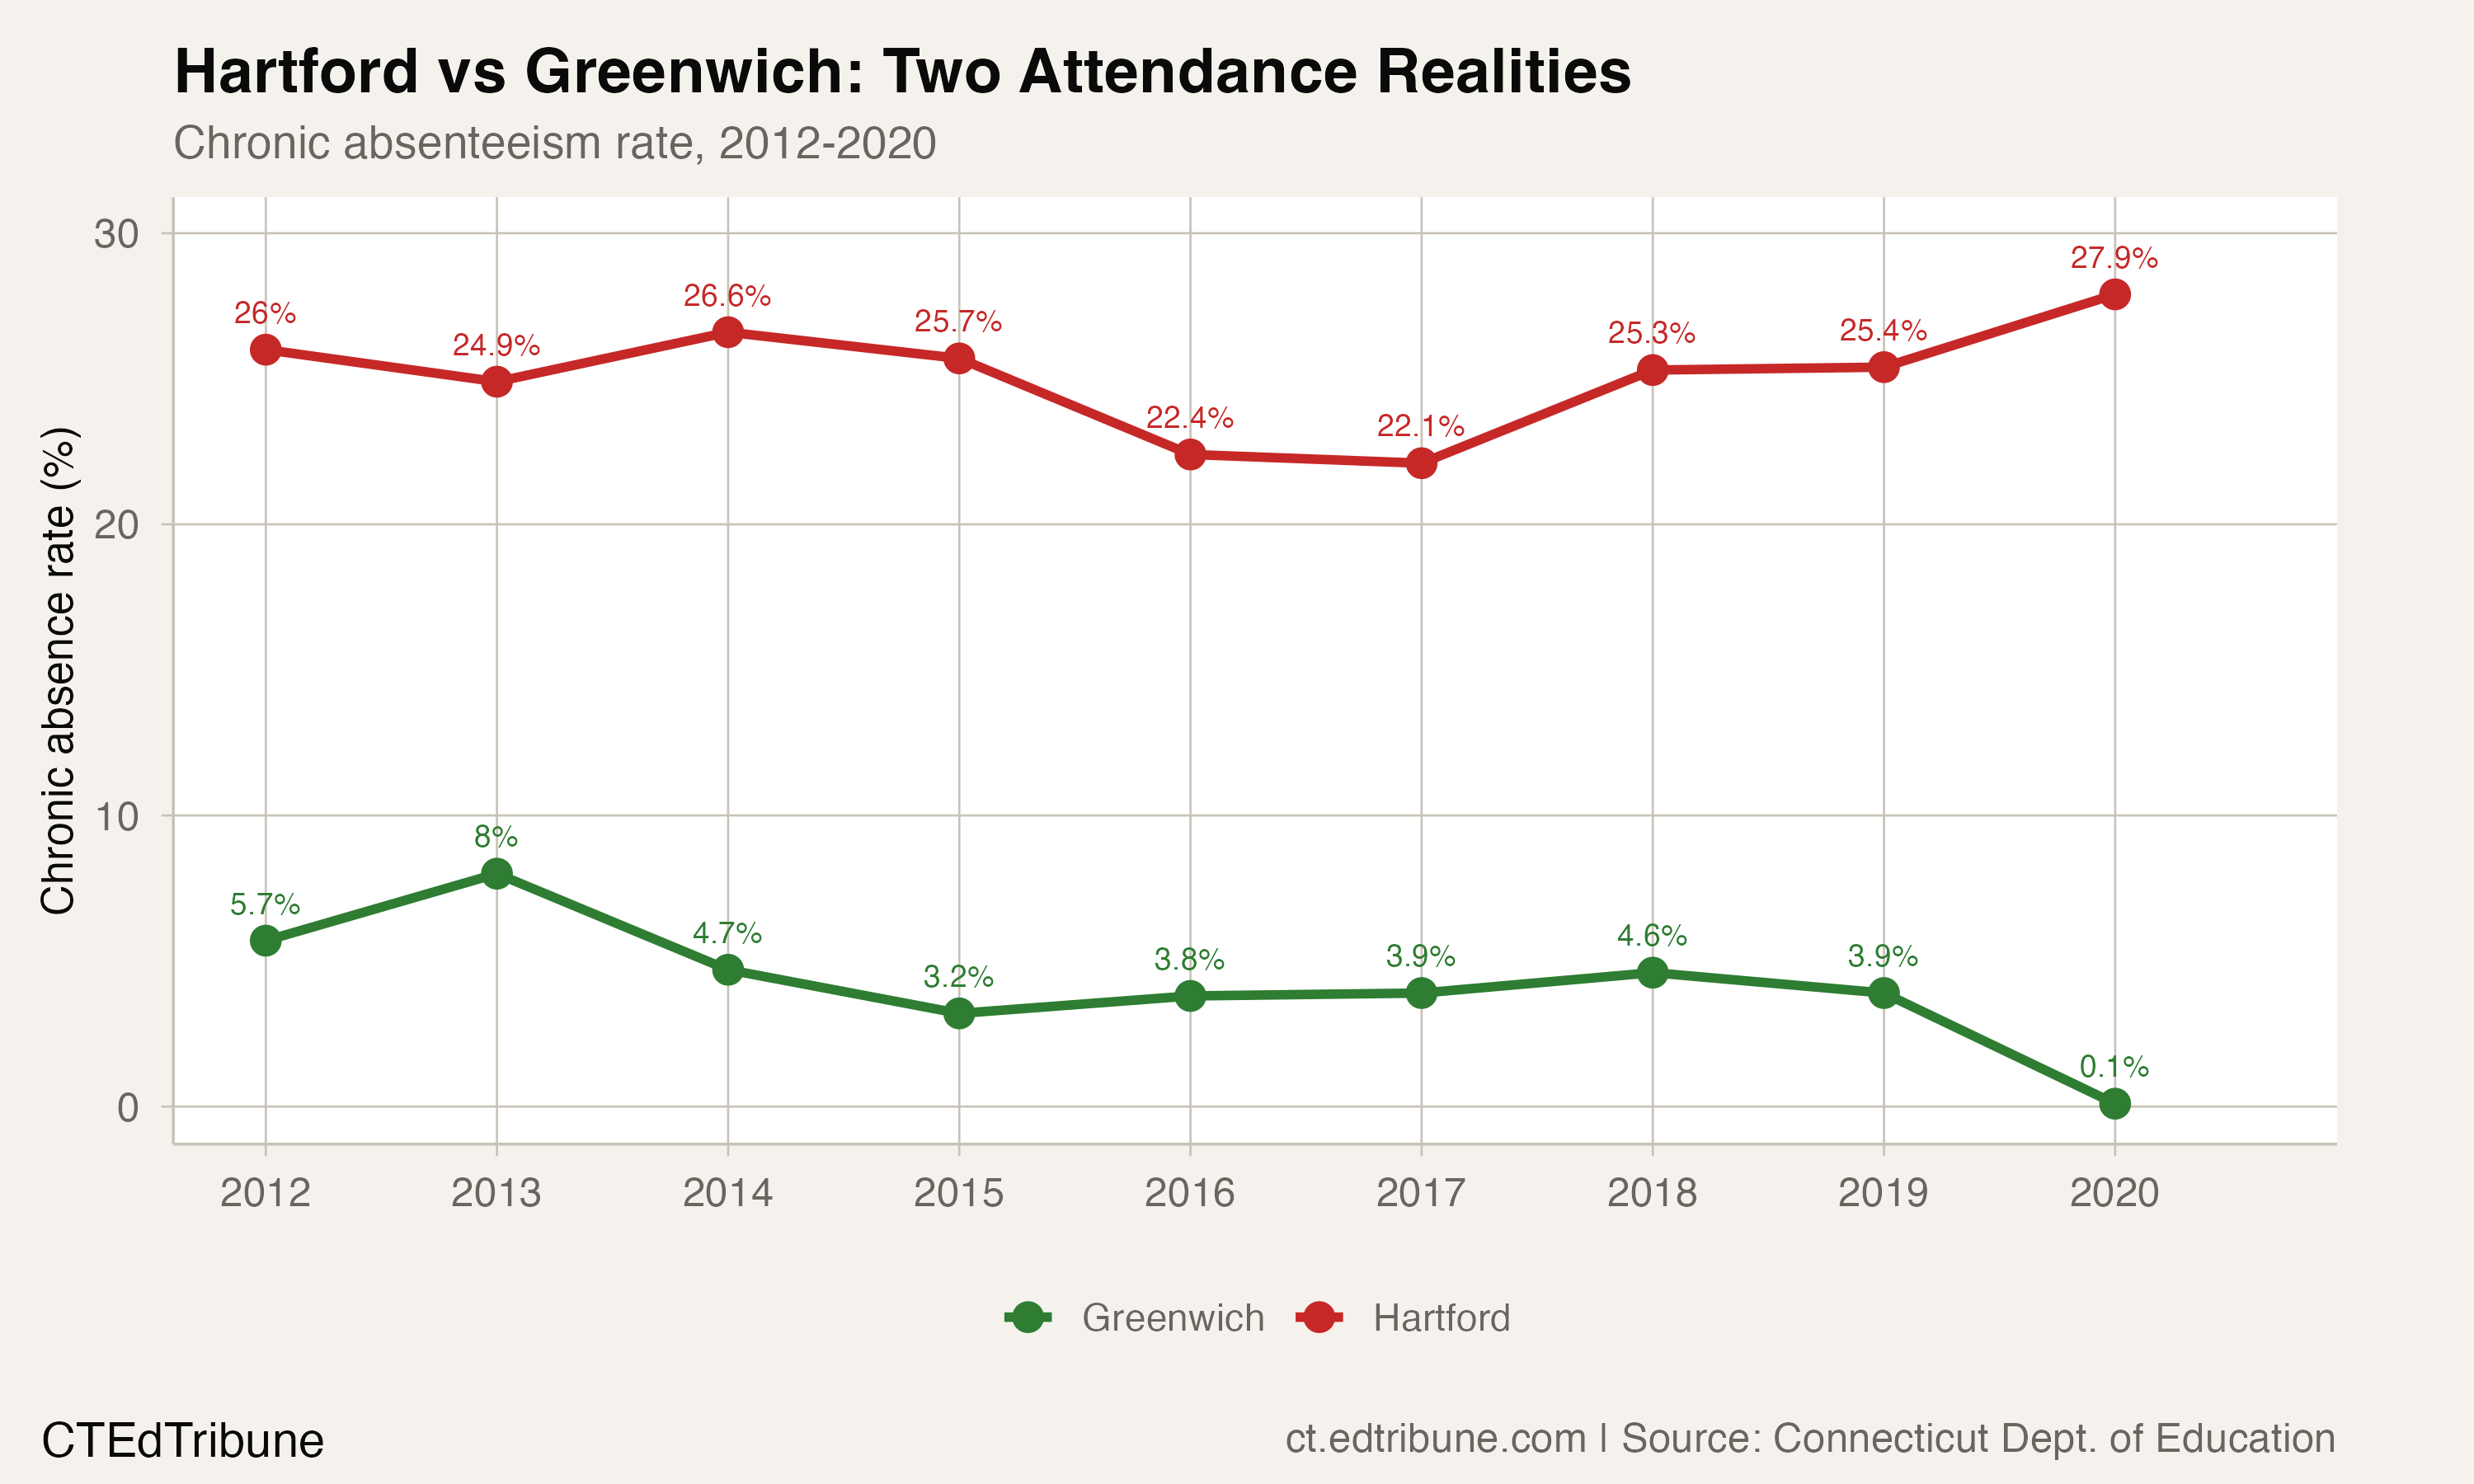
Greenwich↗ET reported a 0.1% chronic absenteeism rate in 2020 — one student in a thousand missing 10% or more of school days. Forty miles southwest on I-95, Hartford↗ET reported 27.9%. Nearly three in ten students chronically absent, in a school year shortened by a pandemic.
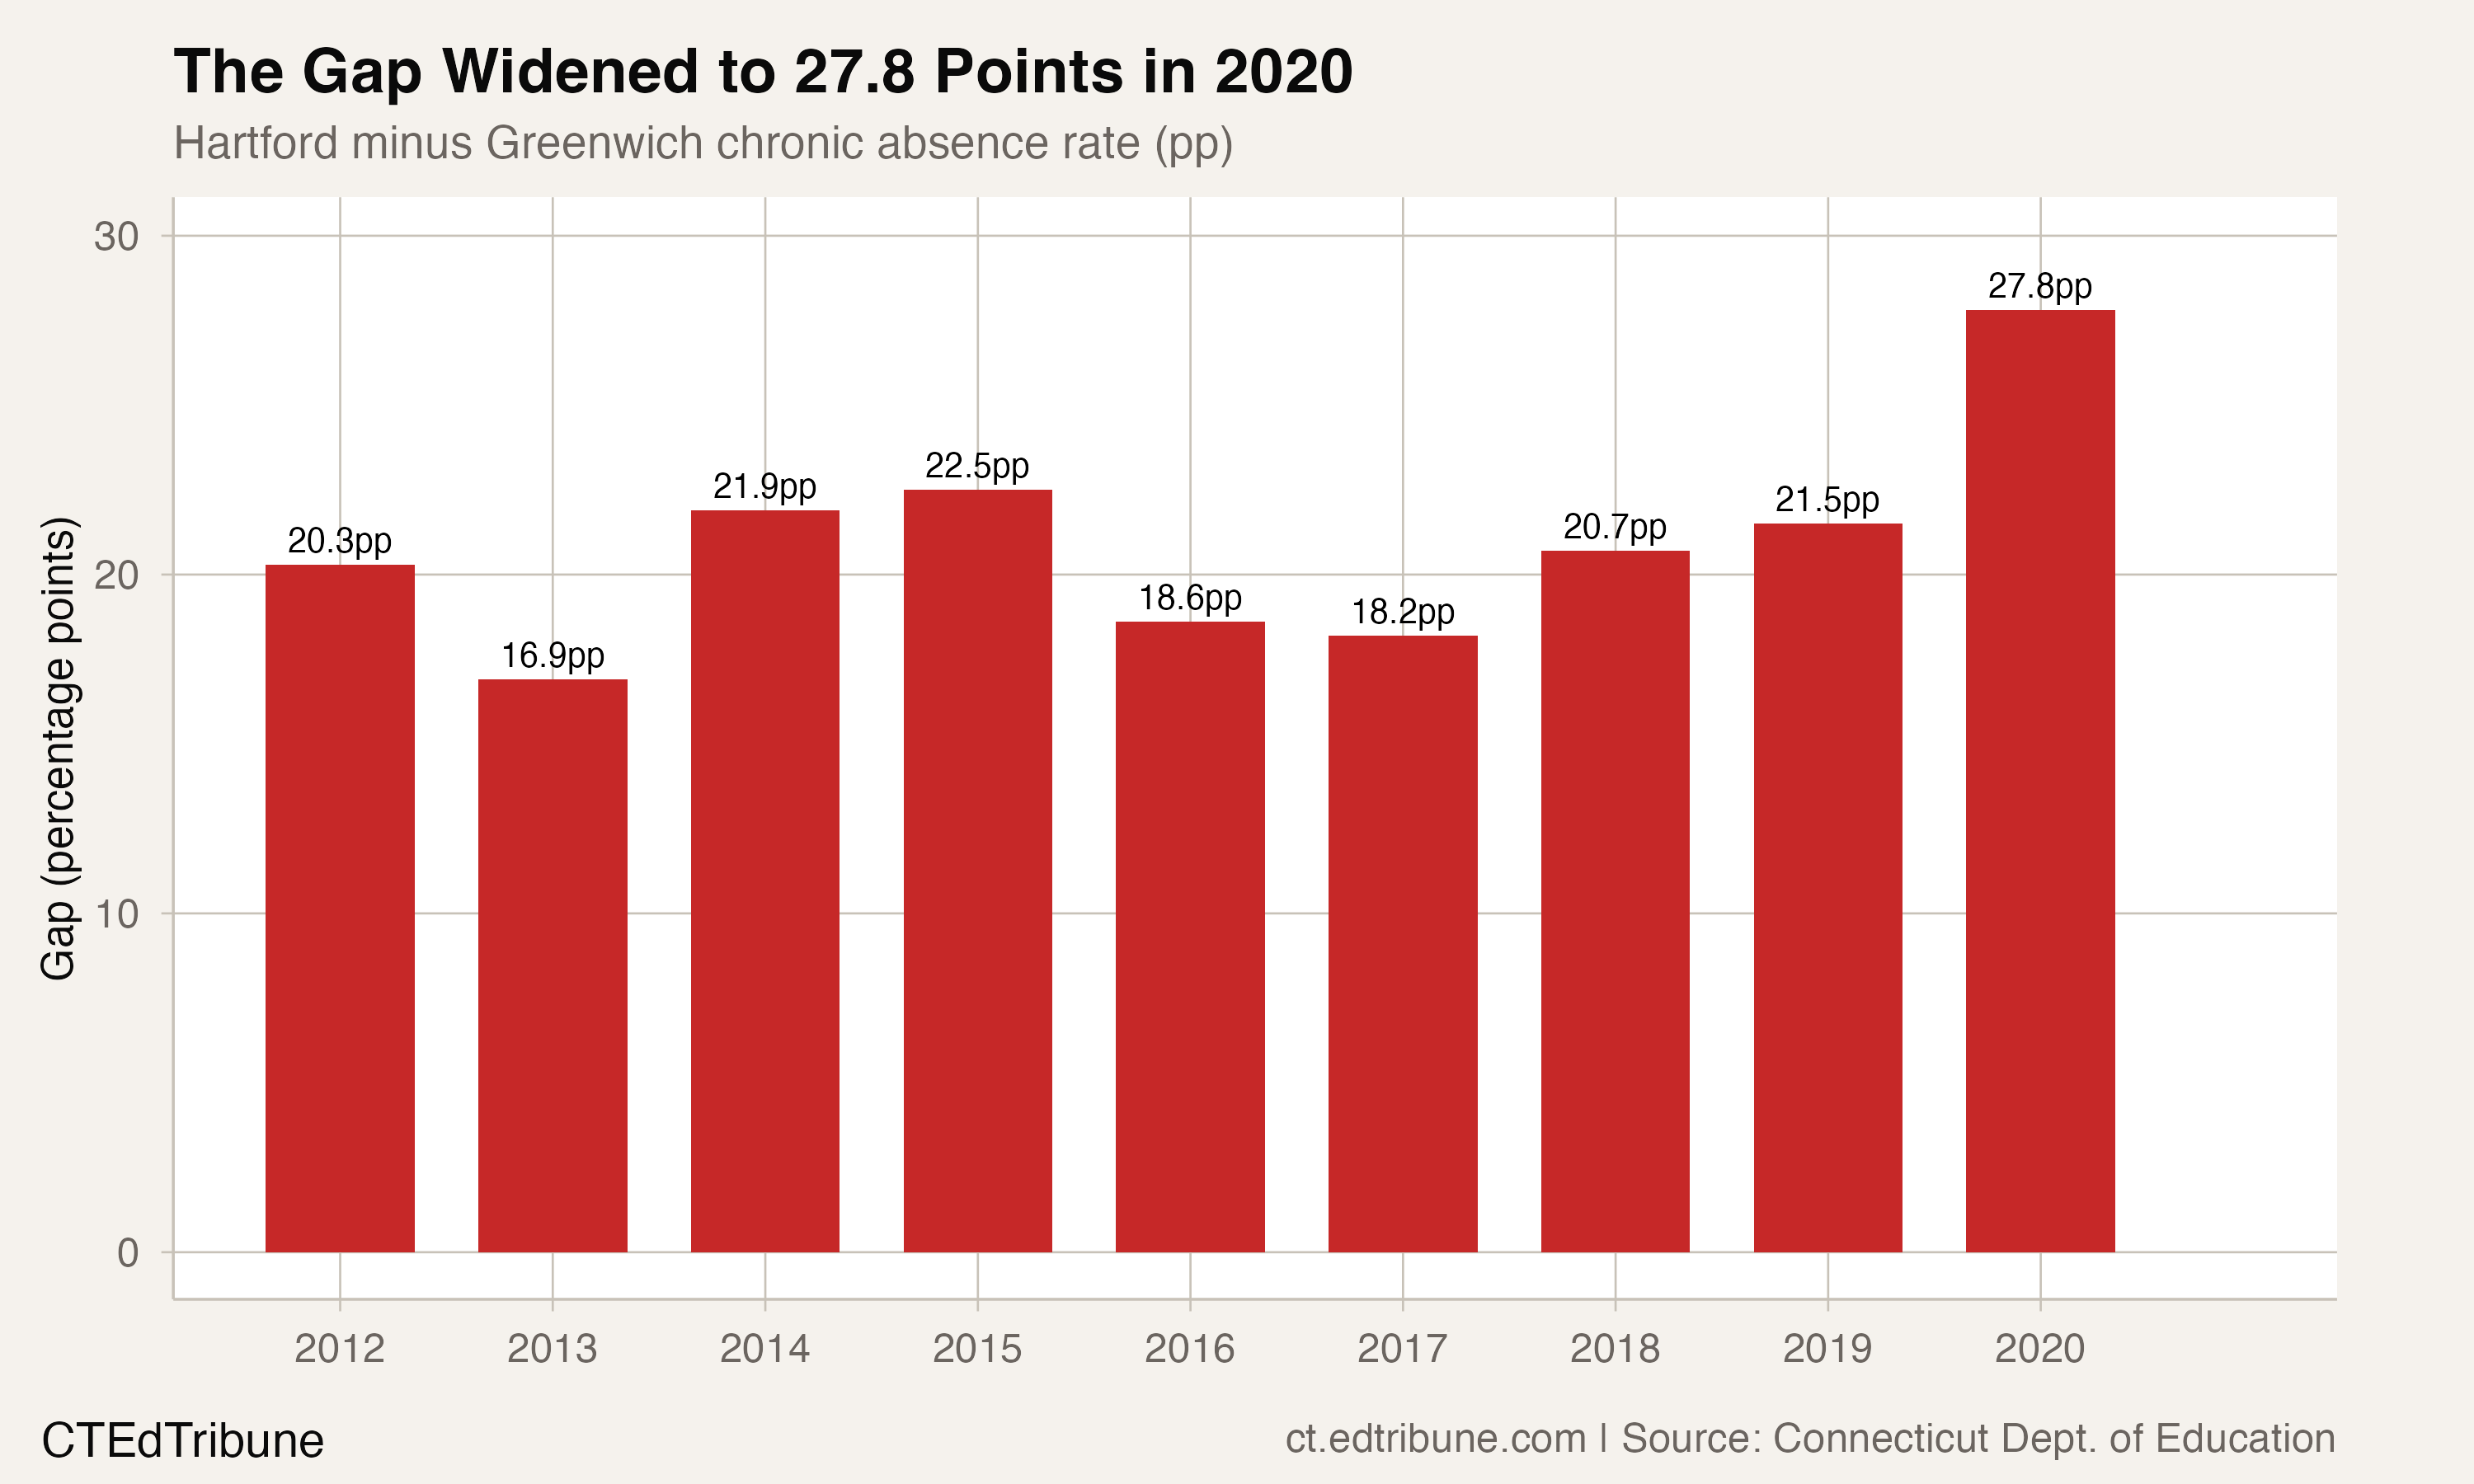
The 27.8 percentage-point gap between Connecticut's wealthiest suburb and its capital city is not new. But it has never been wider.
A gap that was already 20 points before COVID
In 2012, the gap between Hartford and Greenwich stood at 20.3 percentage points — Hartford at 26.0%, Greenwich at 5.7%. Over the next nine years, the two districts traveled in opposite directions. Greenwich cut its chronic absence rate from 5.7% to 0.1%, a 5.6 percentage-point improvement that essentially eliminated the problem. Hartford rose from 26.0% to 27.9%, with the rate never once dipping below 22% in nine years of data.
The gap's narrowest point came in 2013, at 16.9 points — but only because Greenwich had an unusually high year (8.0%) while Hartford happened to dip to 24.9%. The structural chasm was always there.
What makes the 2020 gap so stark is not Hartford's 2020 number — 27.9% was only 1.9 percentage points above its nine-year average of 26.0%. It is Greenwich's near-zero that stretches the distance. Greenwich's 0.1% in 2020 was a 3.8 percentage-point drop from its 2019 rate of 3.9%, the kind of sudden improvement that raises methodological questions about how a shortened school year affected measurement in a district where baseline absence was already low.
Two Connecticuts in 75 minutes of driving
The Hartford-Greenwich comparison is the sharpest expression of a divide that runs through all of Connecticut education. In 2020, Connecticut's Gold Coast suburbs — Greenwich (0.1%), Darien↗ET (5.2%), Weston (5.4%), New Canaan (5.9%), Westport↗ET (8.4%) — occupied a different universe from the state's Alliance Districts, the 33 lowest-performing districts that receive extra state aid.
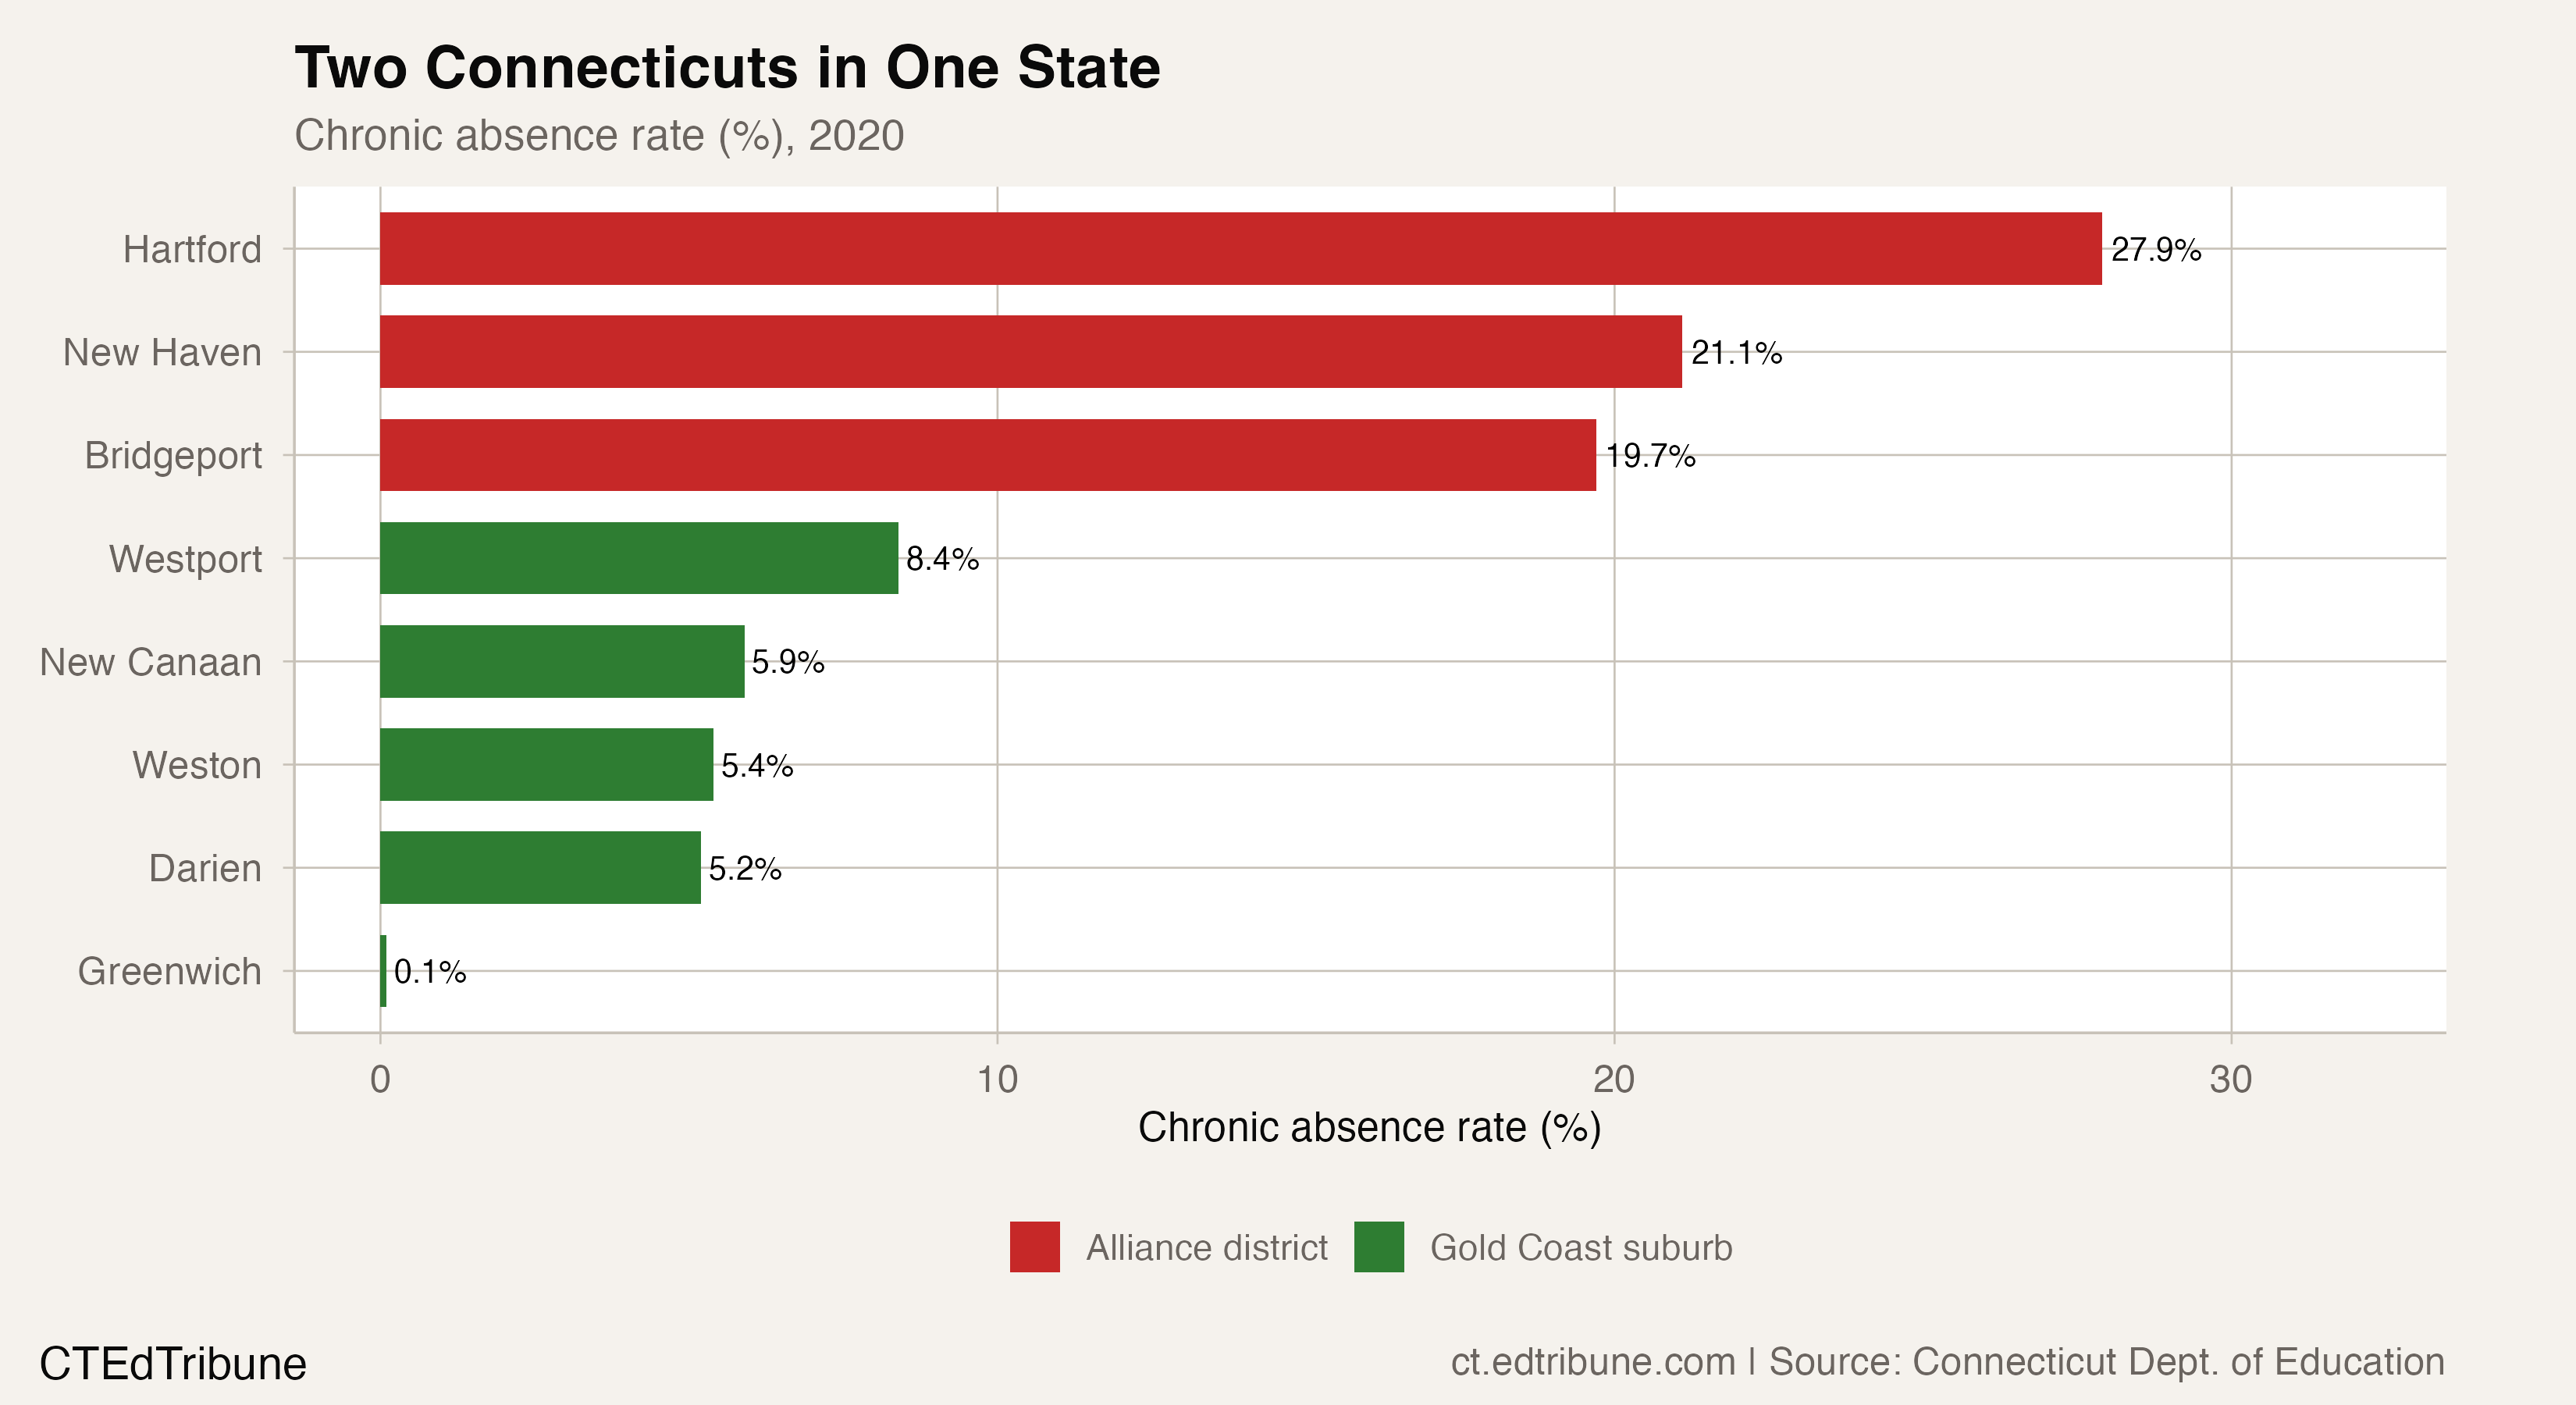
Hartford's 27.9% was the highest among districts reporting total-subgroup data. New Haven↗ET followed at 21.1%, then Bridgeport↗ET at 19.7%. At the bottom, Colebrook reported 0.0% and Greenwich 0.1% — rates so low they suggest virtual elimination of chronic absence as a problem.
Hartford is the fourth-poorest city with over 100,000 residents in the country, with a poverty rate of 34.4%. Greater Hartford, by contrast, has the nation's seventh-highest median income. The city-suburb divide is not just educational. It is economic, spatial, and generational — and the attendance data reflects it with uncomfortable precision.
Hartford's structural floor
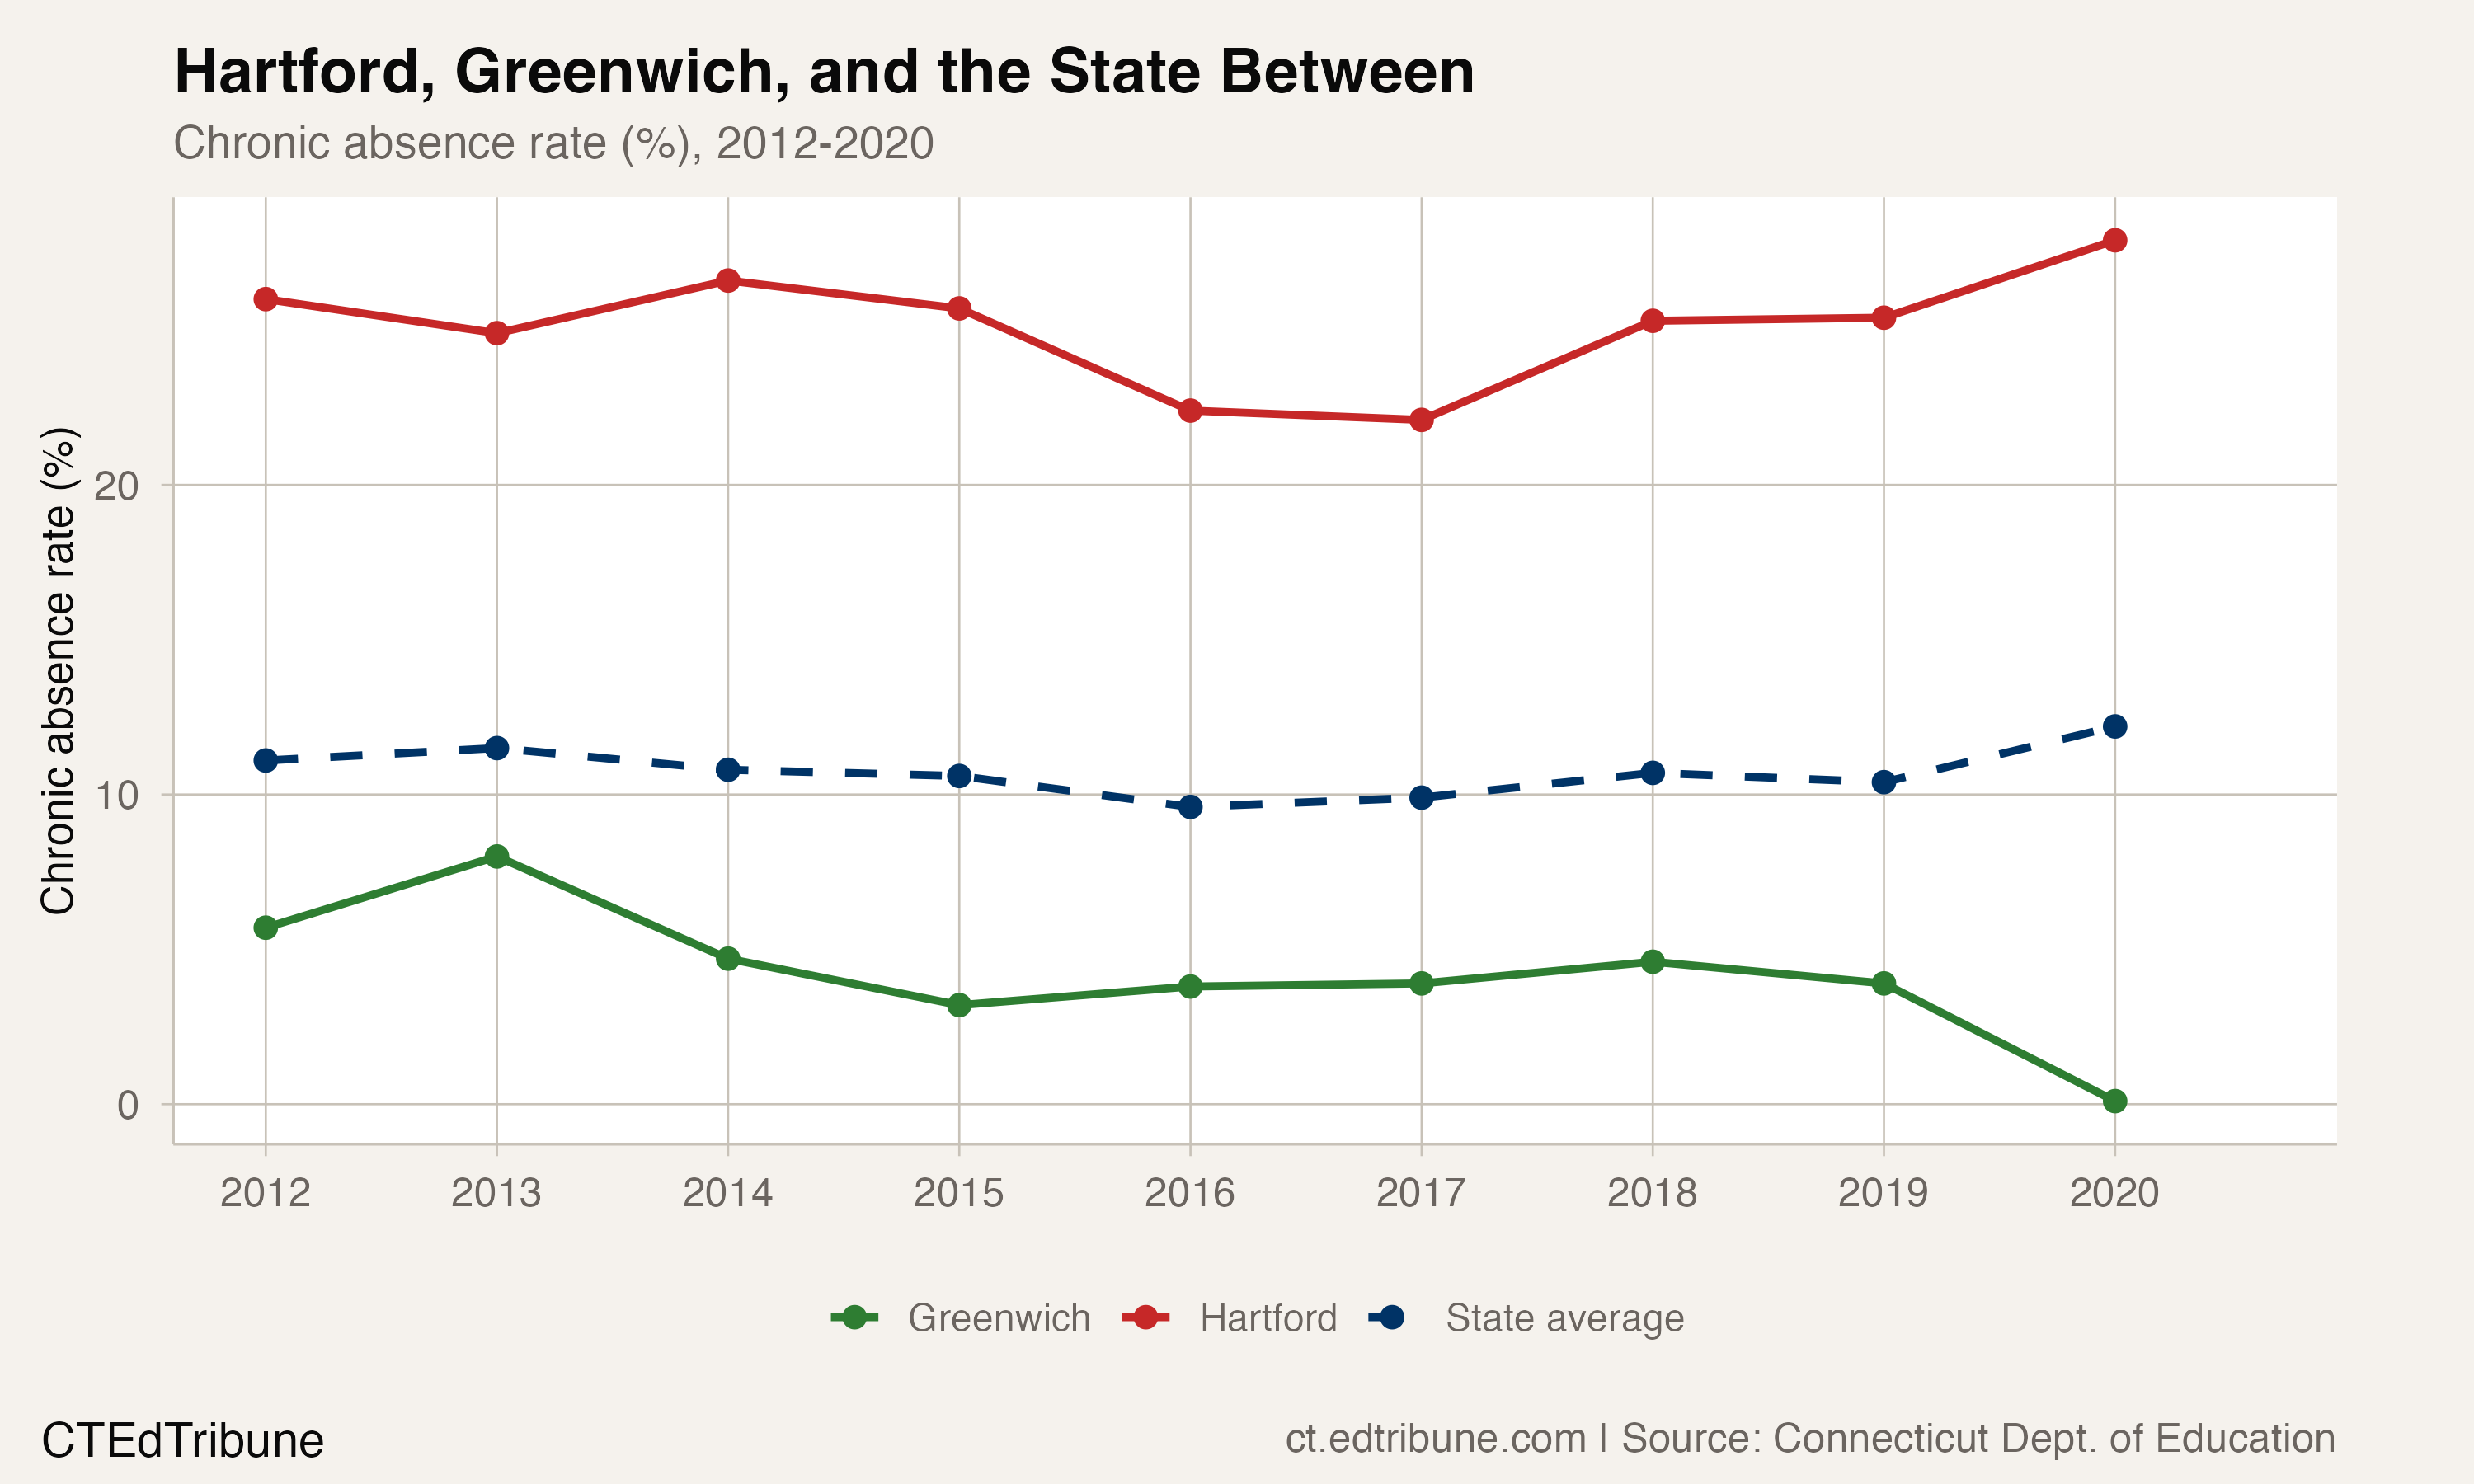
Hartford's trajectory deserves its own scrutiny. The district's chronic absence rate traced an arc that mirrors the state's V-shape, but at dramatically higher altitude: 26.0% in 2012, down to a trough of 22.1% in 2017, then back up to 27.9% in 2020. The trough of 22.1% — Hartford's best year in nine — was still more than double the statewide average of 9.9% that same year.
The 2018 reversal was sharp. Hartford jumped from 22.1% to 25.3% in a single year, a 3.2 percentage-point spike that came well before COVID. The 2019-to-2020 spike of 2.5 points pushed the rate to its highest level in the dataset.
Web research shows the trajectory would only worsen: Hartford's chronic absenteeism peaked at 46% in 2021, nearly doubling from the already-alarming pre-COVID baseline, before the state's LEAP home-visitation program helped bring it down to 36.2% by 2024-25. Even that recovery leaves Hartford's rate three times the statewide figure.
The question Greenwich's number raises
Greenwich's 0.1% in 2020 is worth interrogating, not just celebrating. The rate fell from 3.9% in 2019 to 0.1% in a year when schools were closed for three months. One plausible explanation: with fewer school days in the denominator, students in low-absence districts were less likely to cross the 10% threshold. A student who missed 5 days out of 180 is fine; a student who missed 5 days out of 120 is still fine. But a student who missed 18 days out of 180 is chronically absent, while the shortened year may have prevented them from accumulating enough absences to be flagged.
In higher-absence districts like Hartford, students were already missing at rates far above the threshold, so the shortened year made less difference to their classification.
Greenwich's achievement is real — the district's rate fell steadily from 8.0% in 2013 — but the 0.1% in 2020 likely overstates the improvement. The district was probably closer to its 2019 rate of 3.9% in behavioral terms.
What the gap costs
Connecticut ranks third-worst in education equality nationally, a finding from CT Voices that predates the pandemic. The attendance gap is one expression of a broader pattern: student achievement breaks sharply along racial and economic lines, with white students testing at grade level at twice the rate of Black and Latino students.
Connecticut directs $2.46 billion annually through its Education Cost Sharing formula and provides supplemental funding to its 33 Alliance Districts. The state launched the LEAP program in 2021, sending trained home visitors to families of chronically absent students — a program that produced dramatic results, with Hartford seeing attendance improvements of nearly 30 percentage points among participating families.
But no home visitation program changes the fact that Hartford is the fourth-poorest city with over 100,000 residents in the country. Greenwich can virtually eliminate chronic absence because the conditions that cause chronic absence are largely absent from Greenwich. Hartford cannot replicate that through a program, however well-designed.
The 27.8-point gap is not a problem with a program-sized solution. It is a measurement of the distance between two Connecticuts that share a state capitol and little else.
Detailed code that reproduces the analysis and figures in this article is available exclusively to EdTribune subscribers.
Discussion
Sign in to join the discussion.
Loading comments...