Equity
The 24-Point Gap That Shrank to 14
Hartford and West Hartford share a border and a 13.6-point graduation rate gap that has narrowed by 11 points since 2018, driven by Hartford's climb.
Data-Driven Education Journalism for the Constitution State
Education News & Data
Local education reporting from every corner of Connecticut, grounded in Connecticut Department of Education data.
Middletown's new superintendent, Joseph Macary, says the achievement gap starts in kindergarten. The district's published prekindergarten count grew from 123 to 237 over the last dozen reporting years.
The gap between all students and high-needs students shrank from 9.4 points to 1.6 over a decade, alongside gains in cities like Waterbury and New Britain.
New Britain graduates 71% in four years, lowest among CT traditional districts. But its high-needs students nearly match the state average.
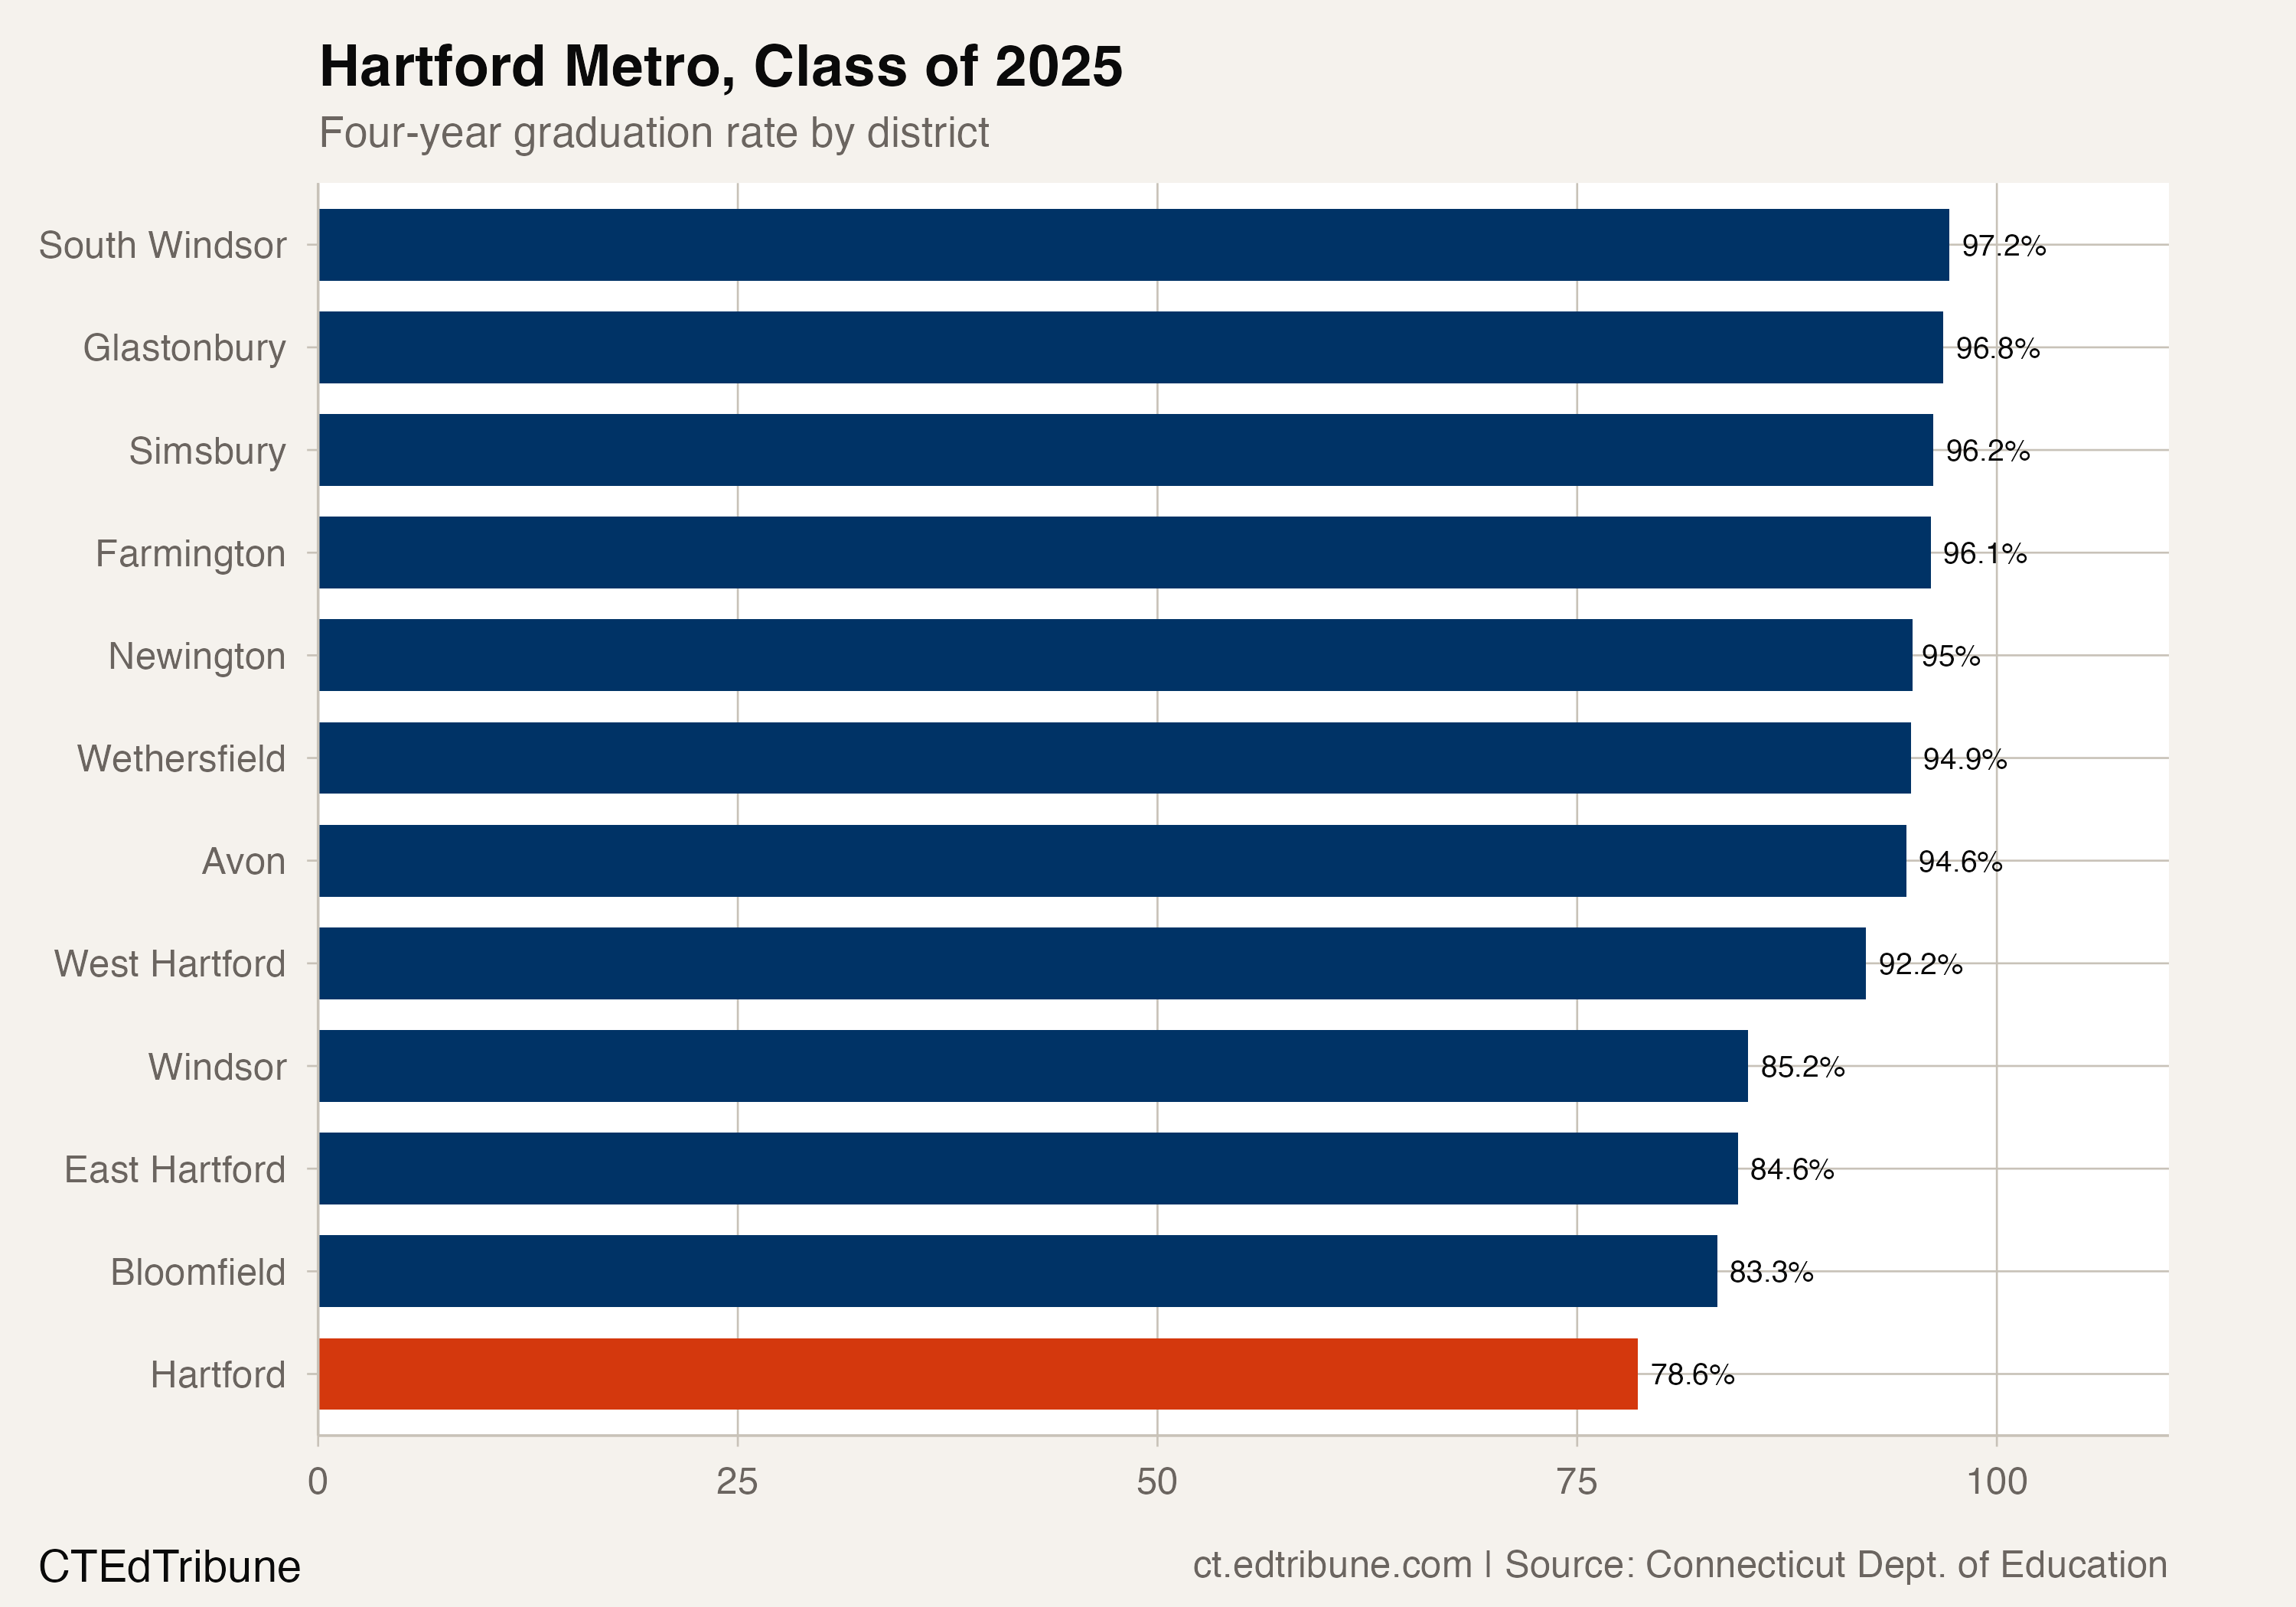
Hartford's four-year adjusted cohort graduation rate reached 78.6% in 2025, its highest result in nine available years but still 10.3 points below Connecticut.
Hartford and West Hartford share a border and a 13.6-point graduation rate gap that has narrowed by 11 points since 2018, driven by Hartford's climb.
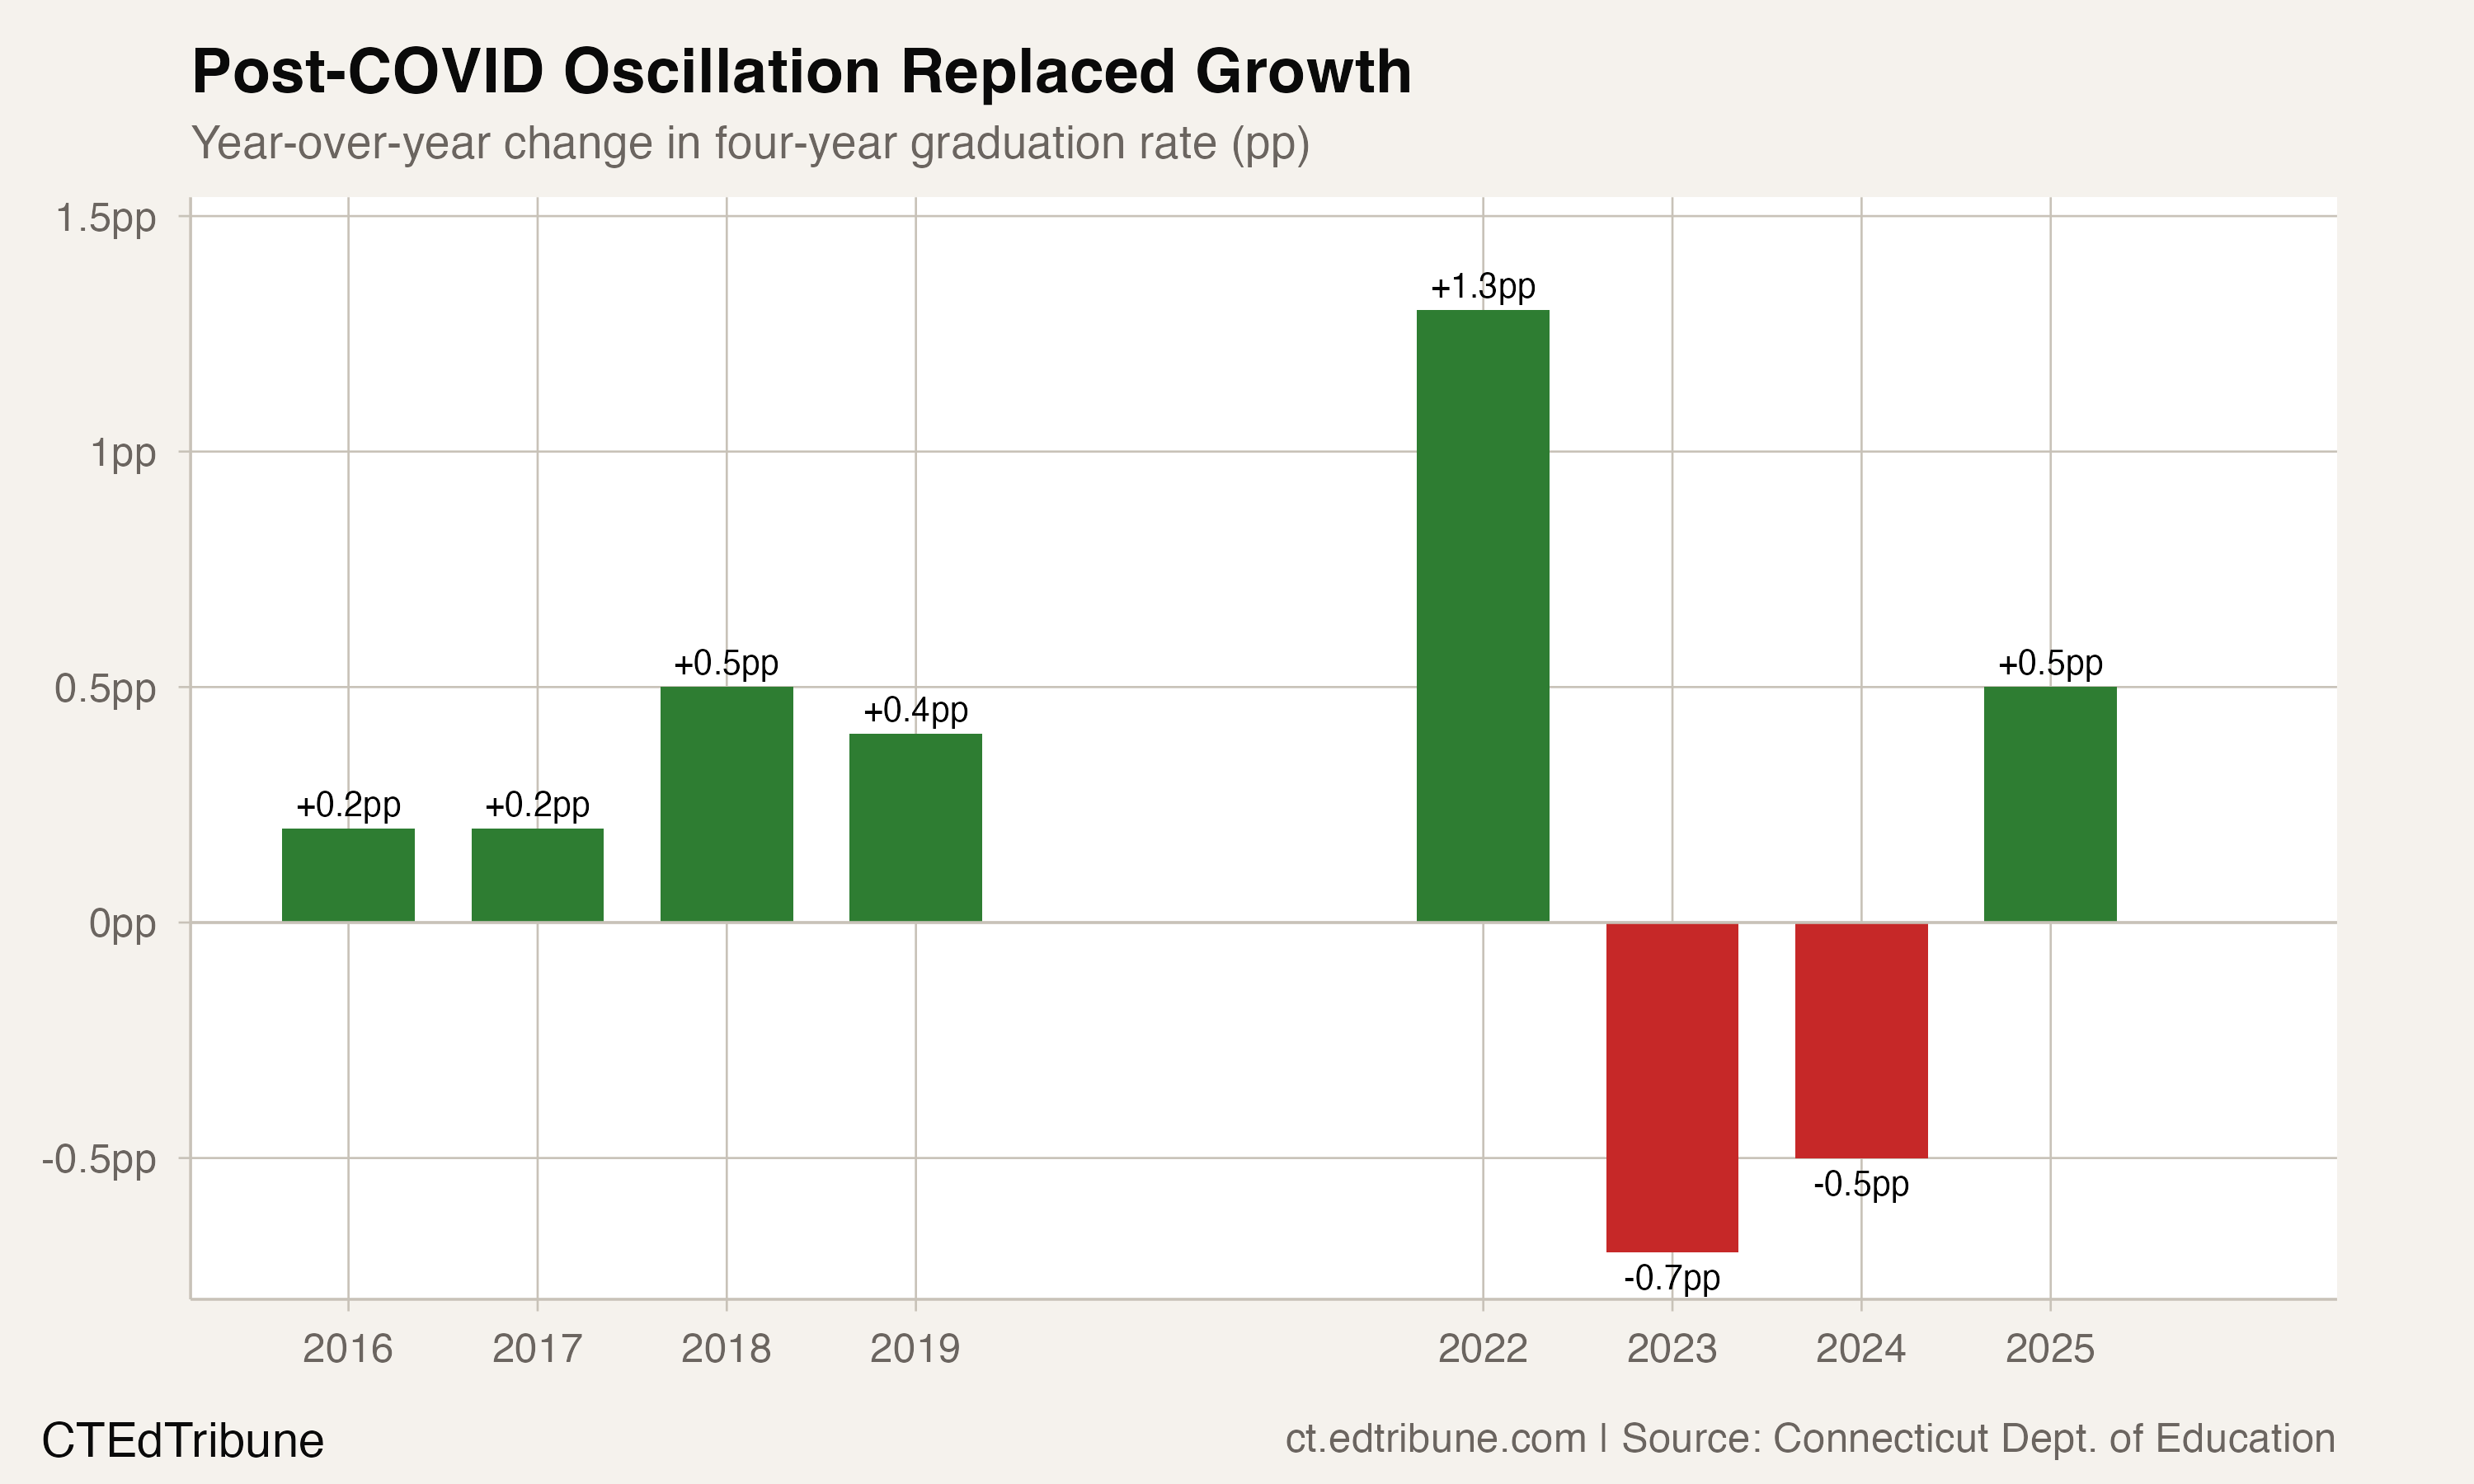
Connecticut's four-year graduation rate has oscillated between 88.4% and 89.6% for four straight years, erasing the pre-COVID trajectory of steady gains.
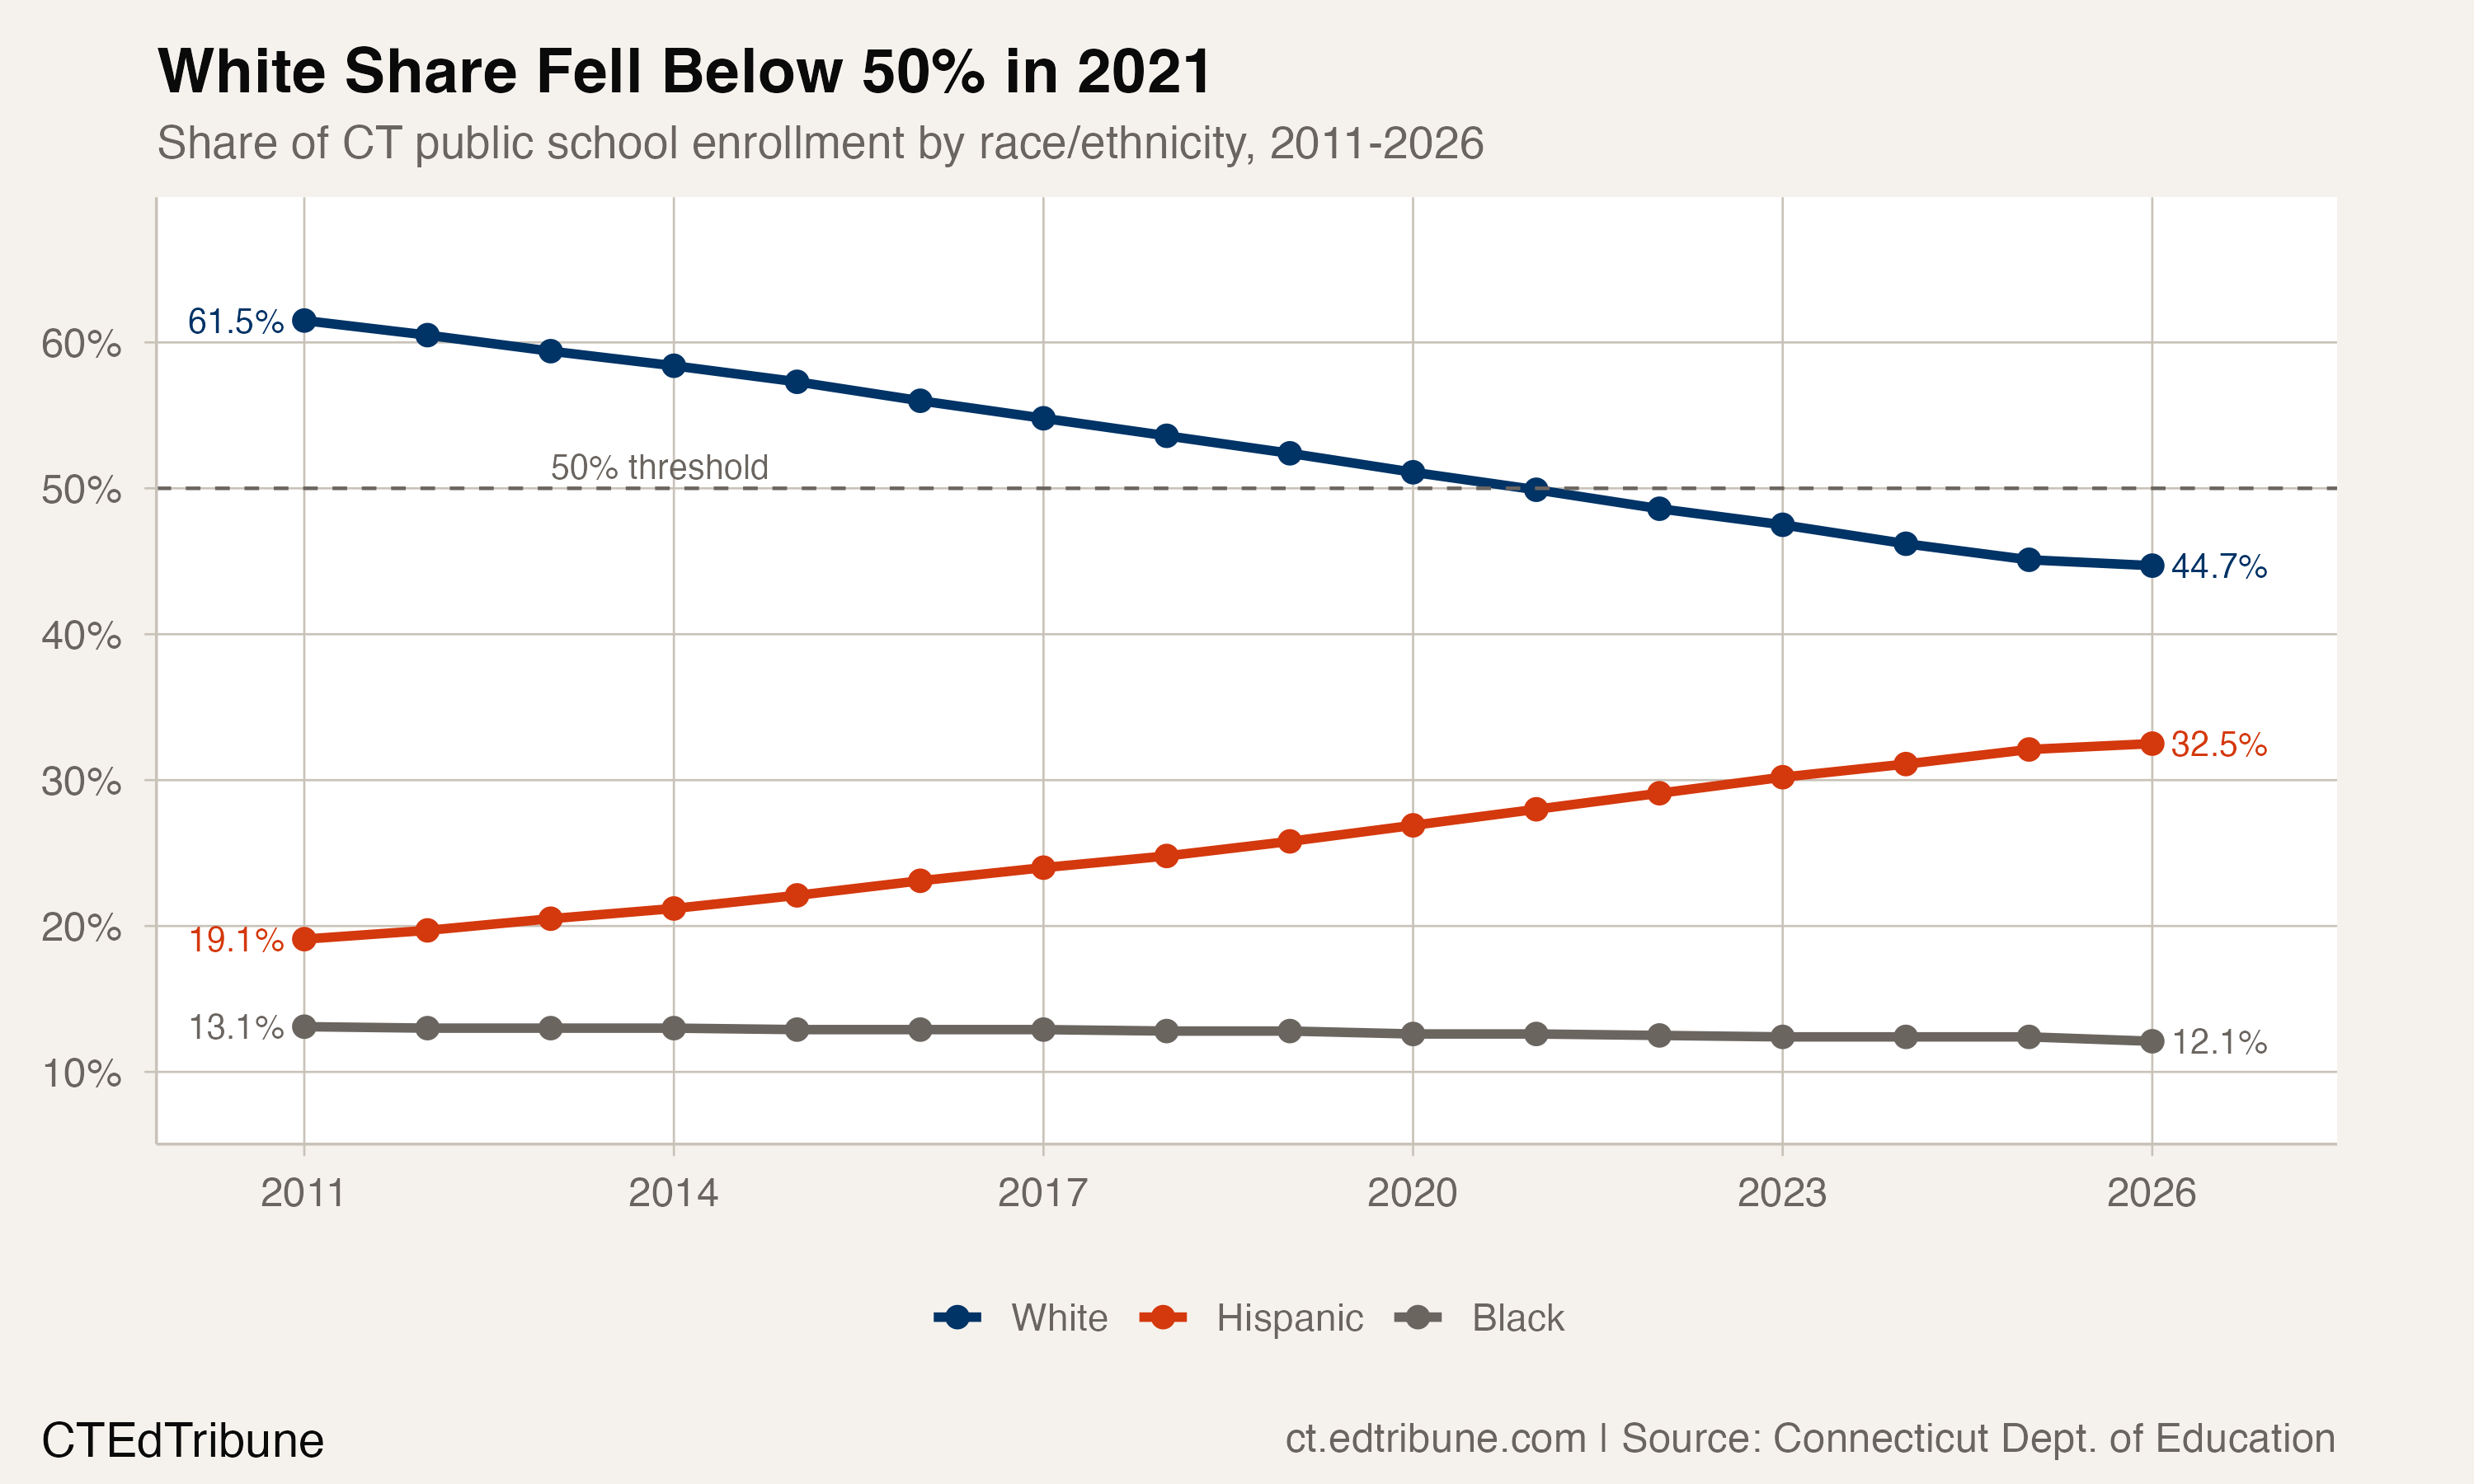
Connecticut's public schools became majority-minority in 2020. Since then, white enrollment fell to 44.7% and Hispanic students have grown to 32.5%.
Thirty-eight districts stayed below the state average for chronic absenteeism every year from 2012 through 2020, showing that sustained low absence is achievable across diverse community types.
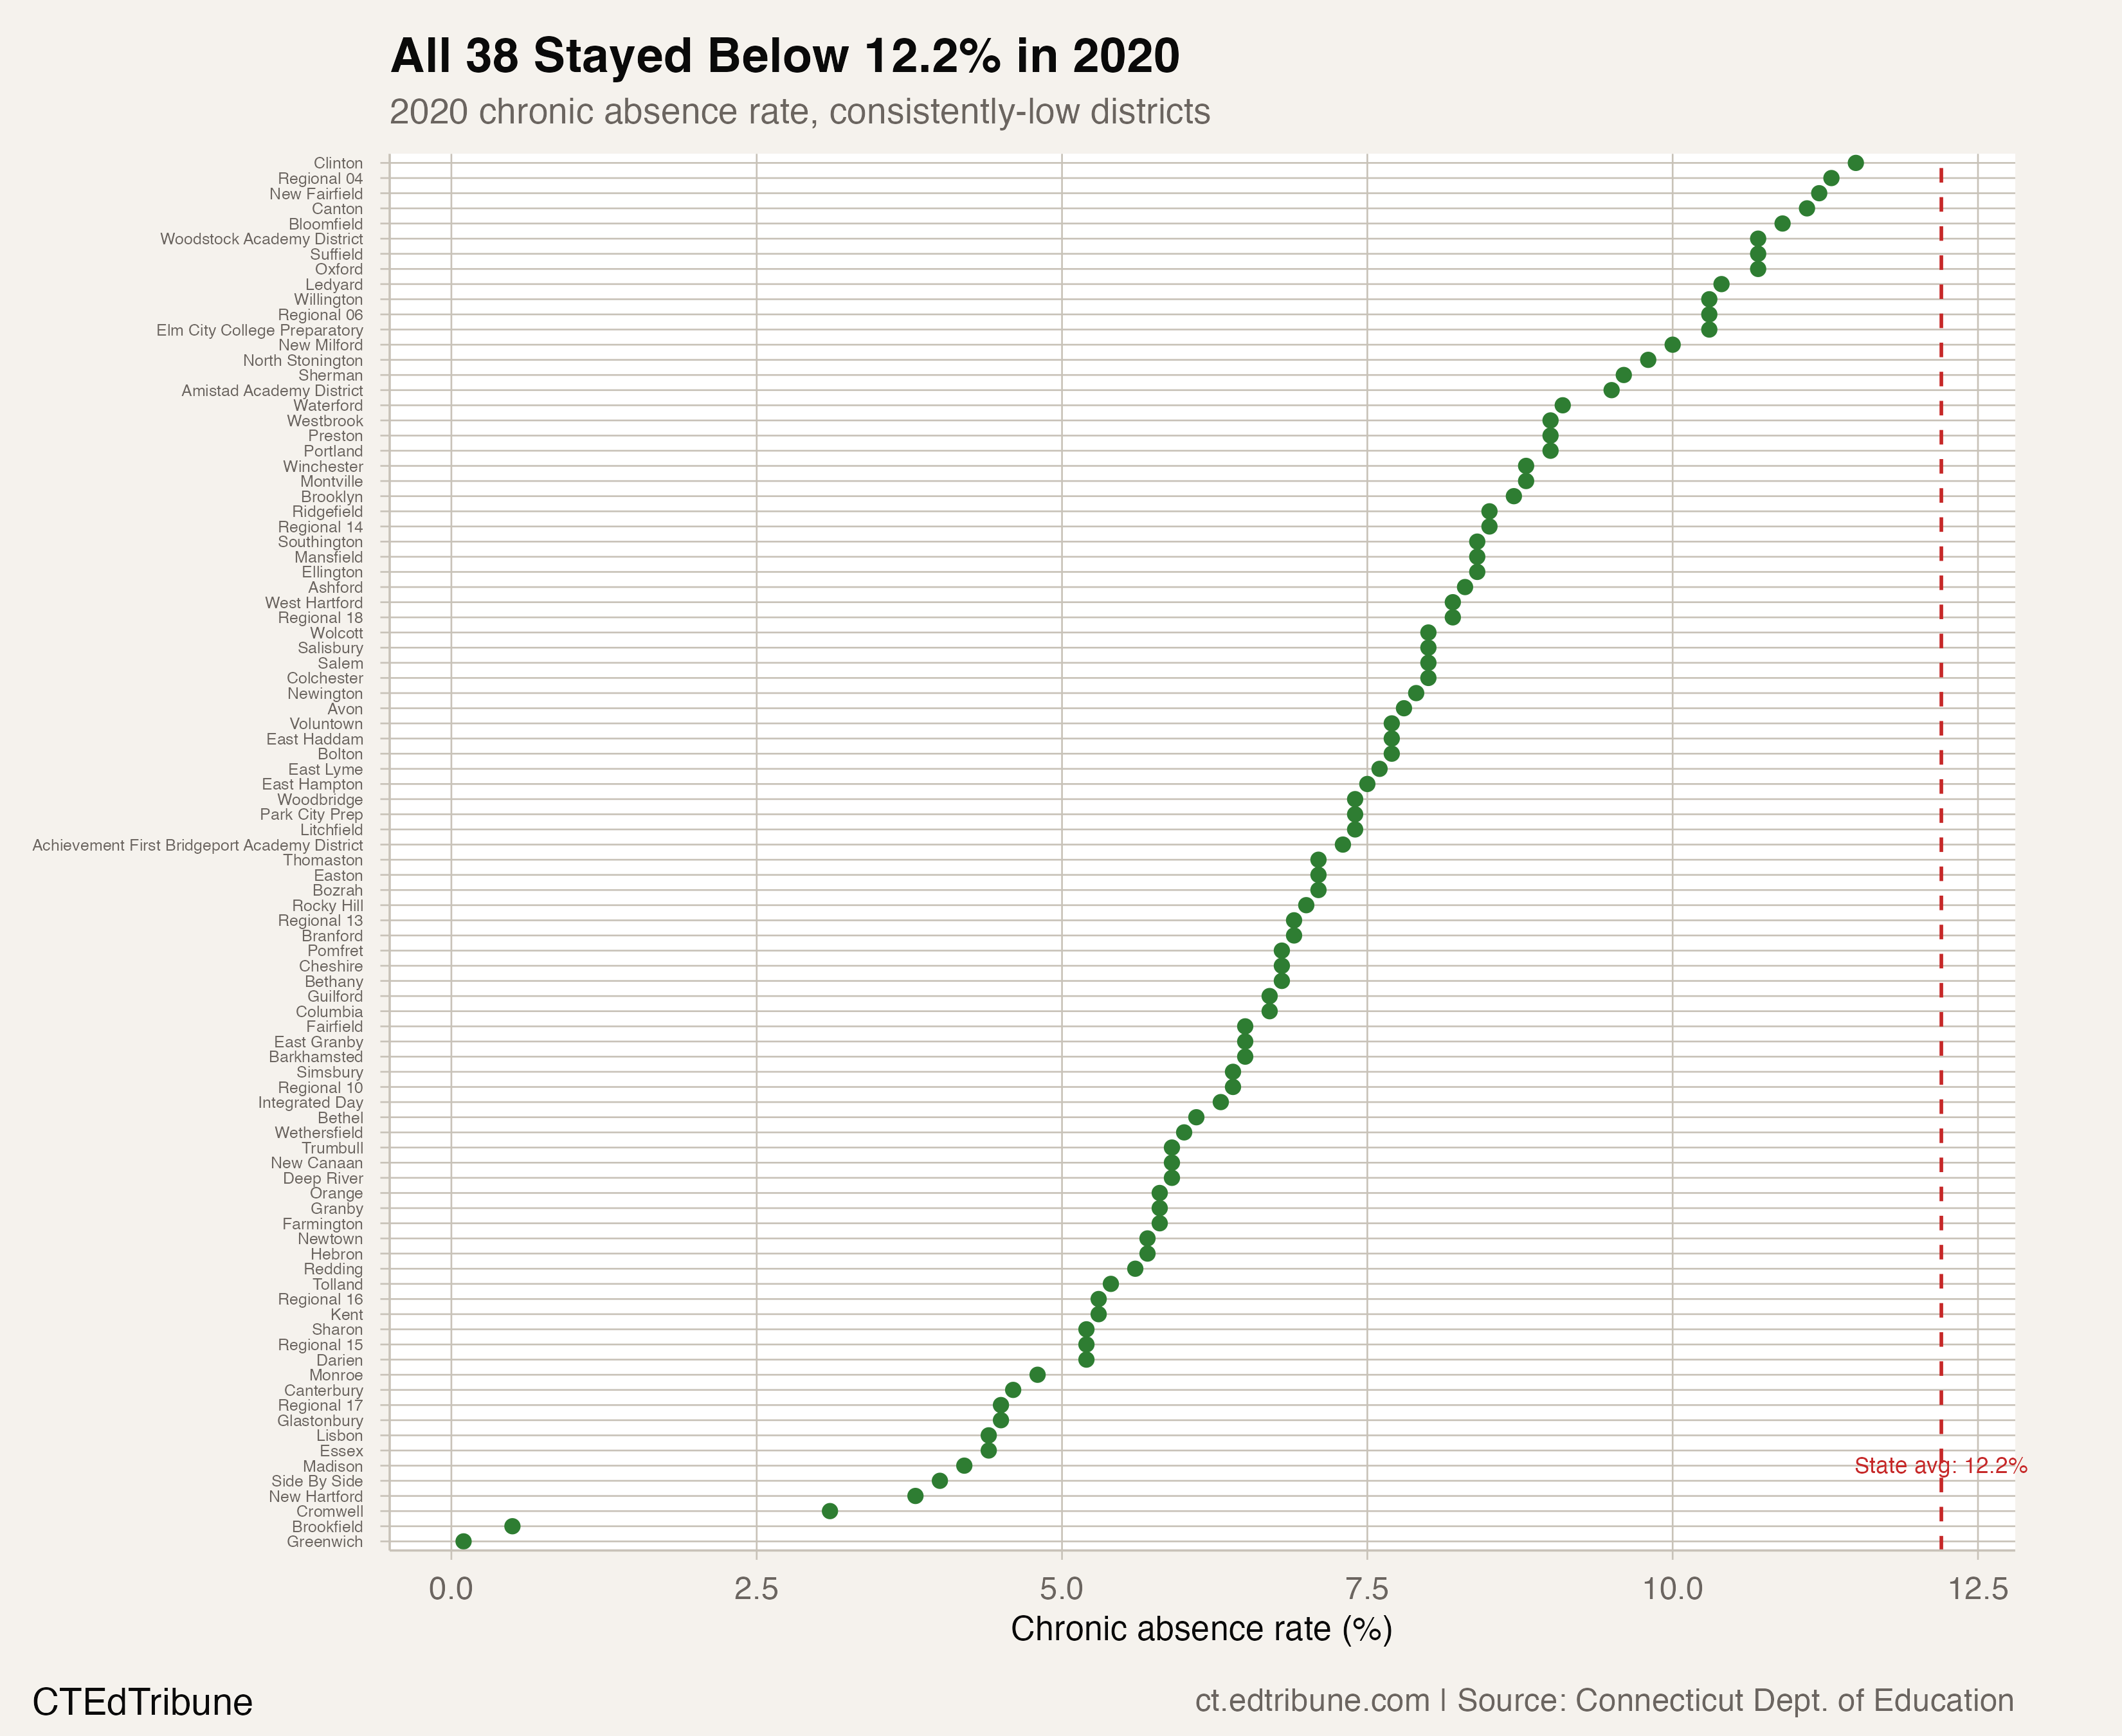
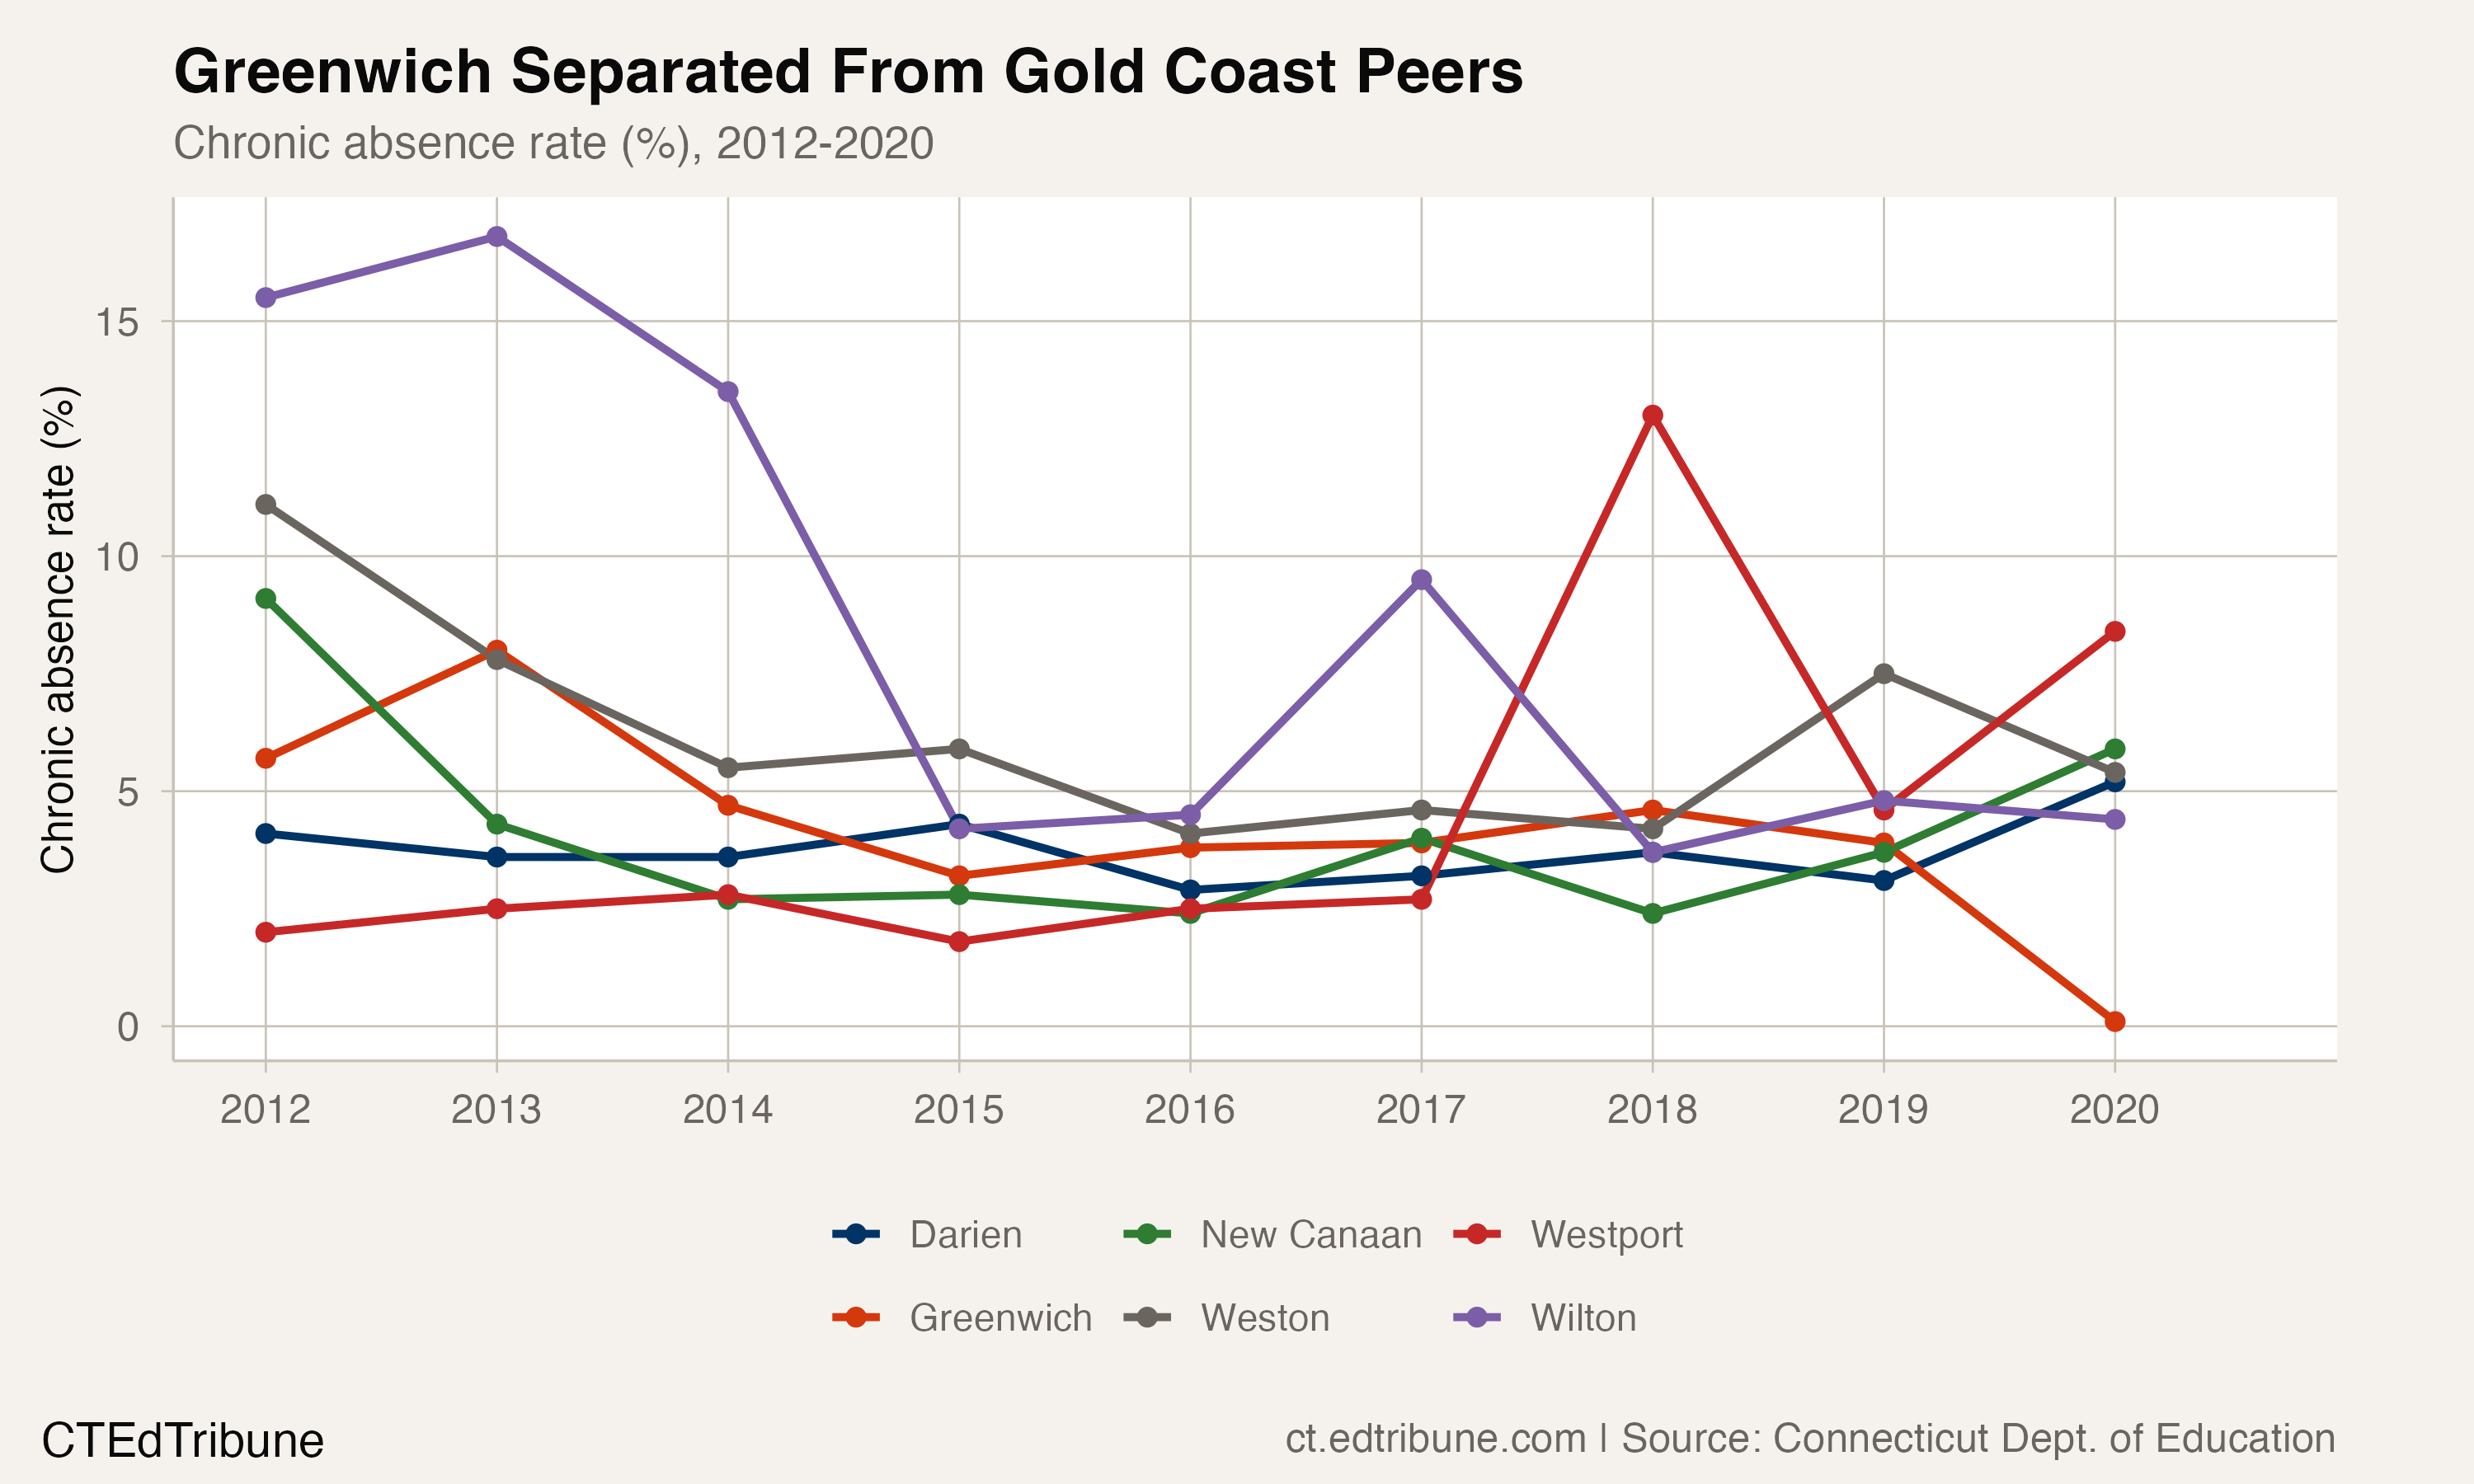
Greenwich School District cut its chronic absenteeism rate from 8% in 2013 to 0.1% in 2020, one of only 8 districts to hit an all-time low during the pandemic-shortened school year.
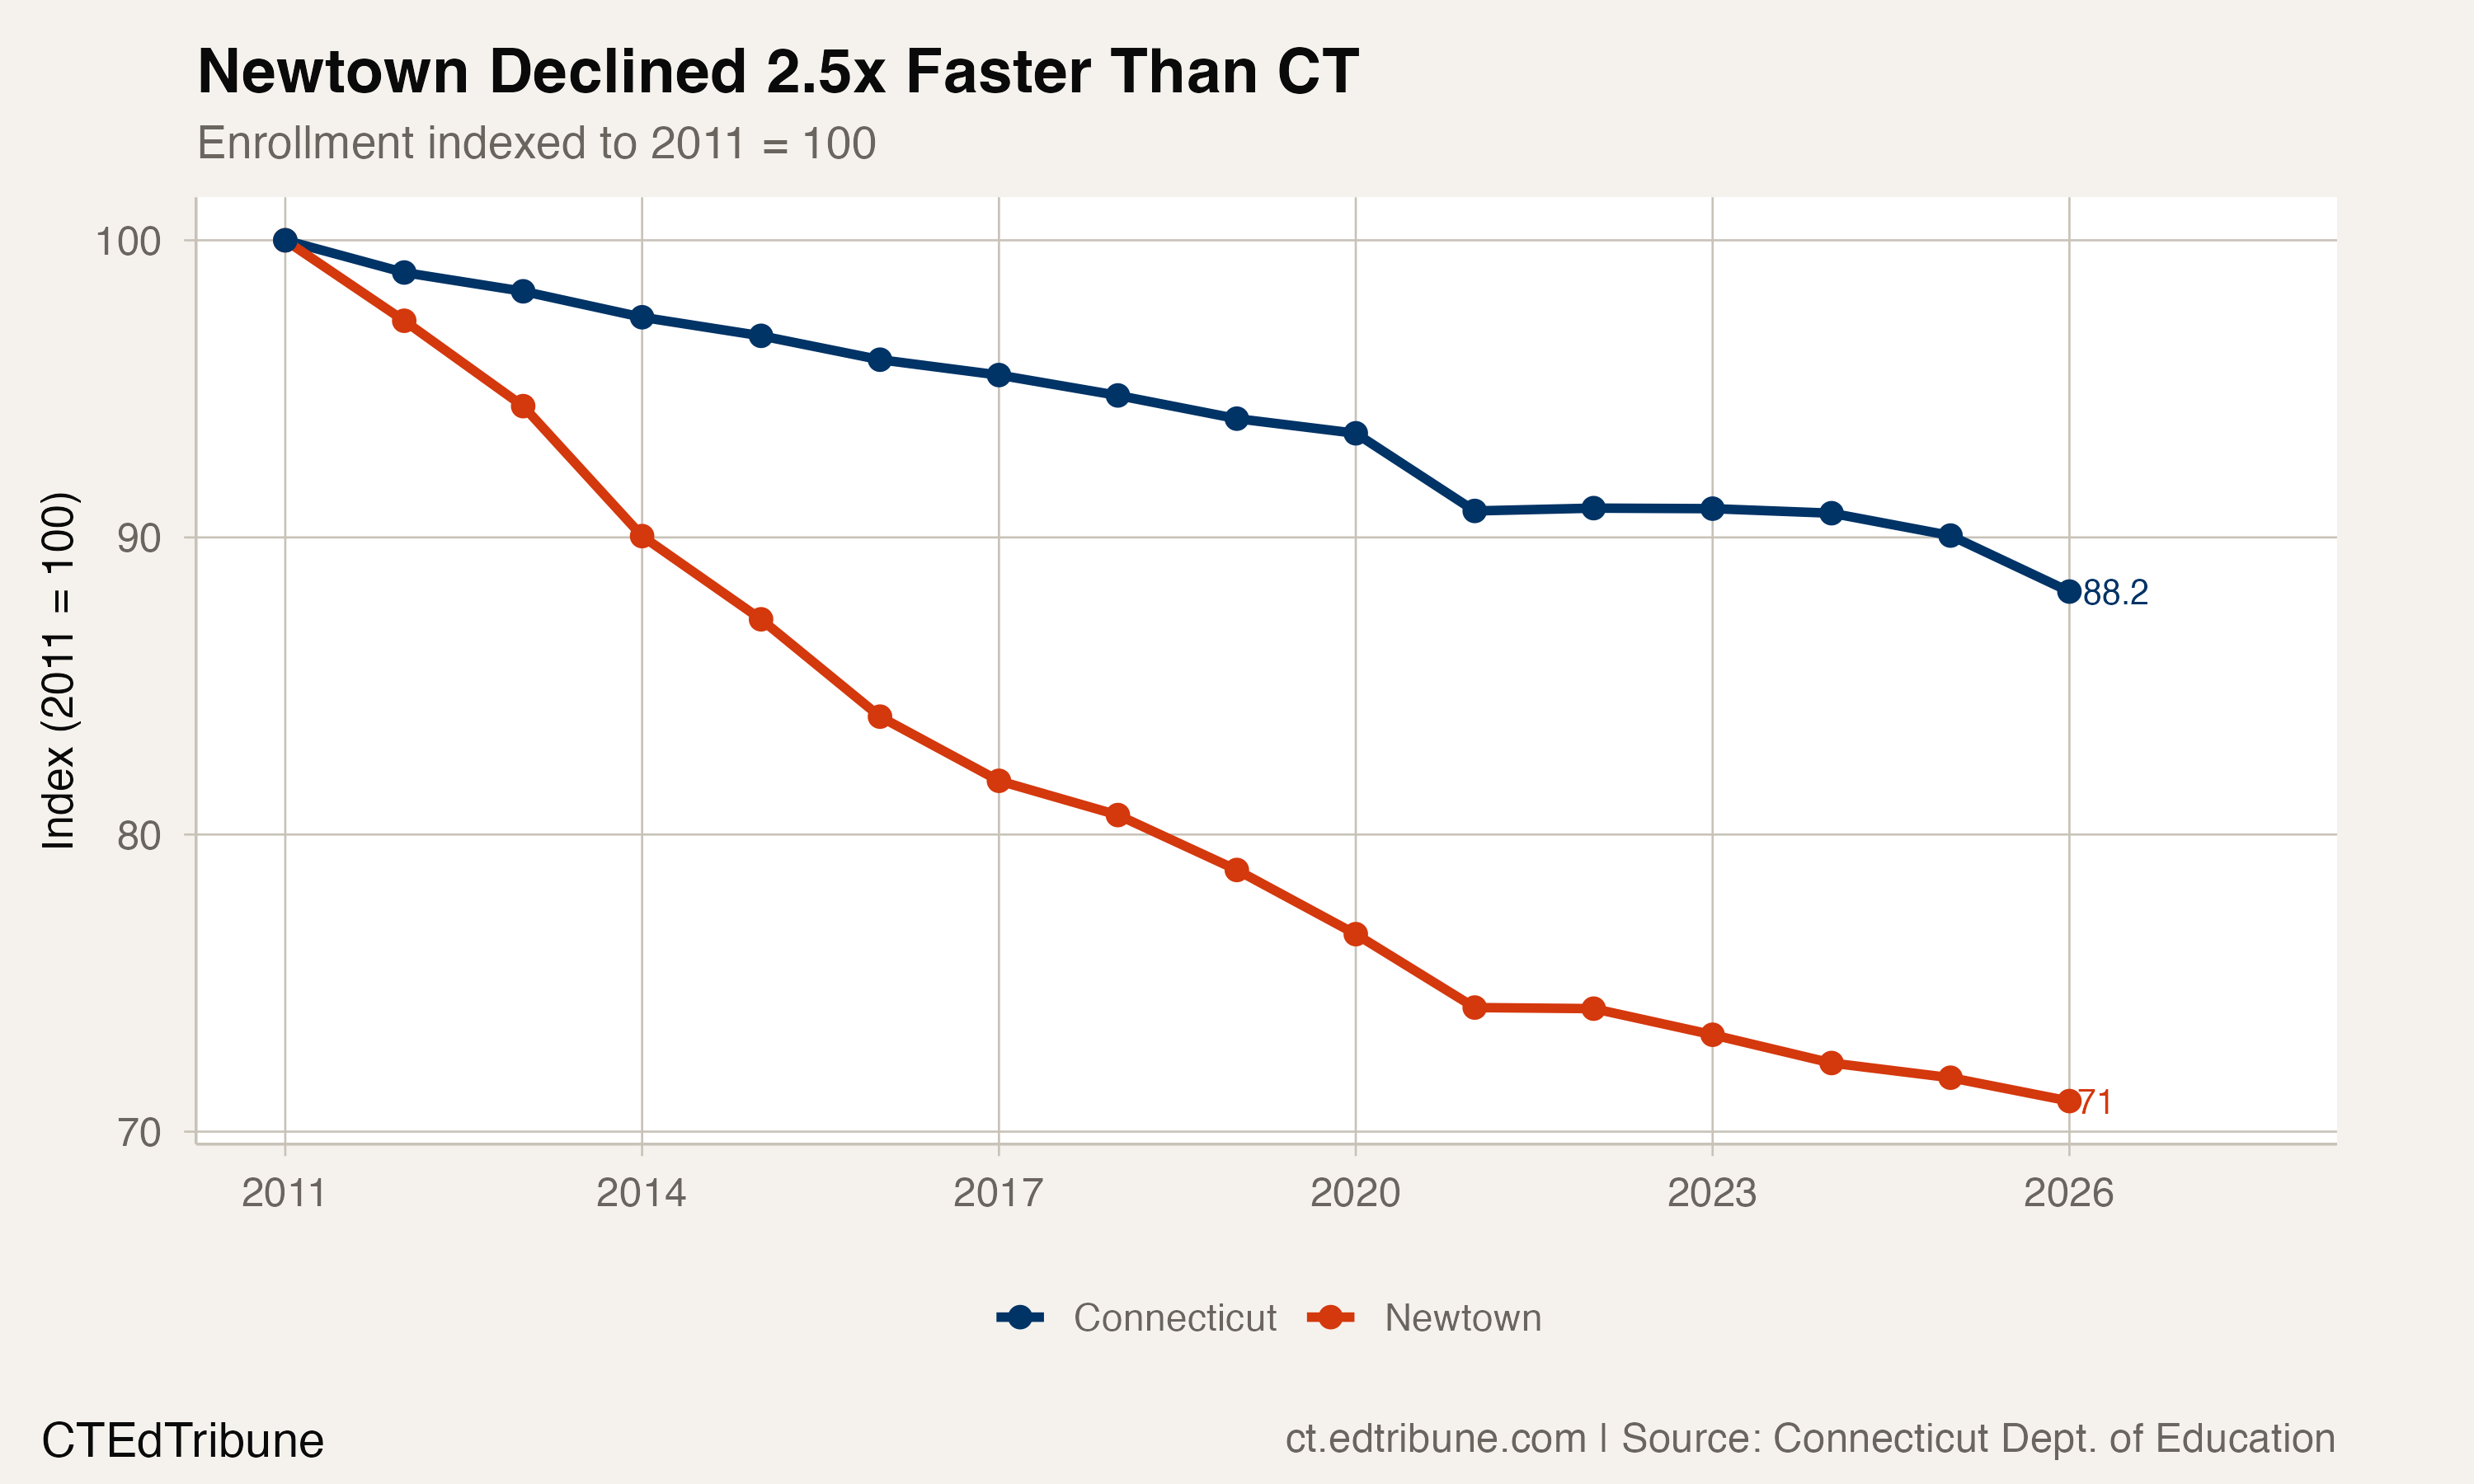
Newtown School District has declined every year since 2012, losing 1,583 students and nearly a third of its enrollment in Connecticut's longest active decline streak.
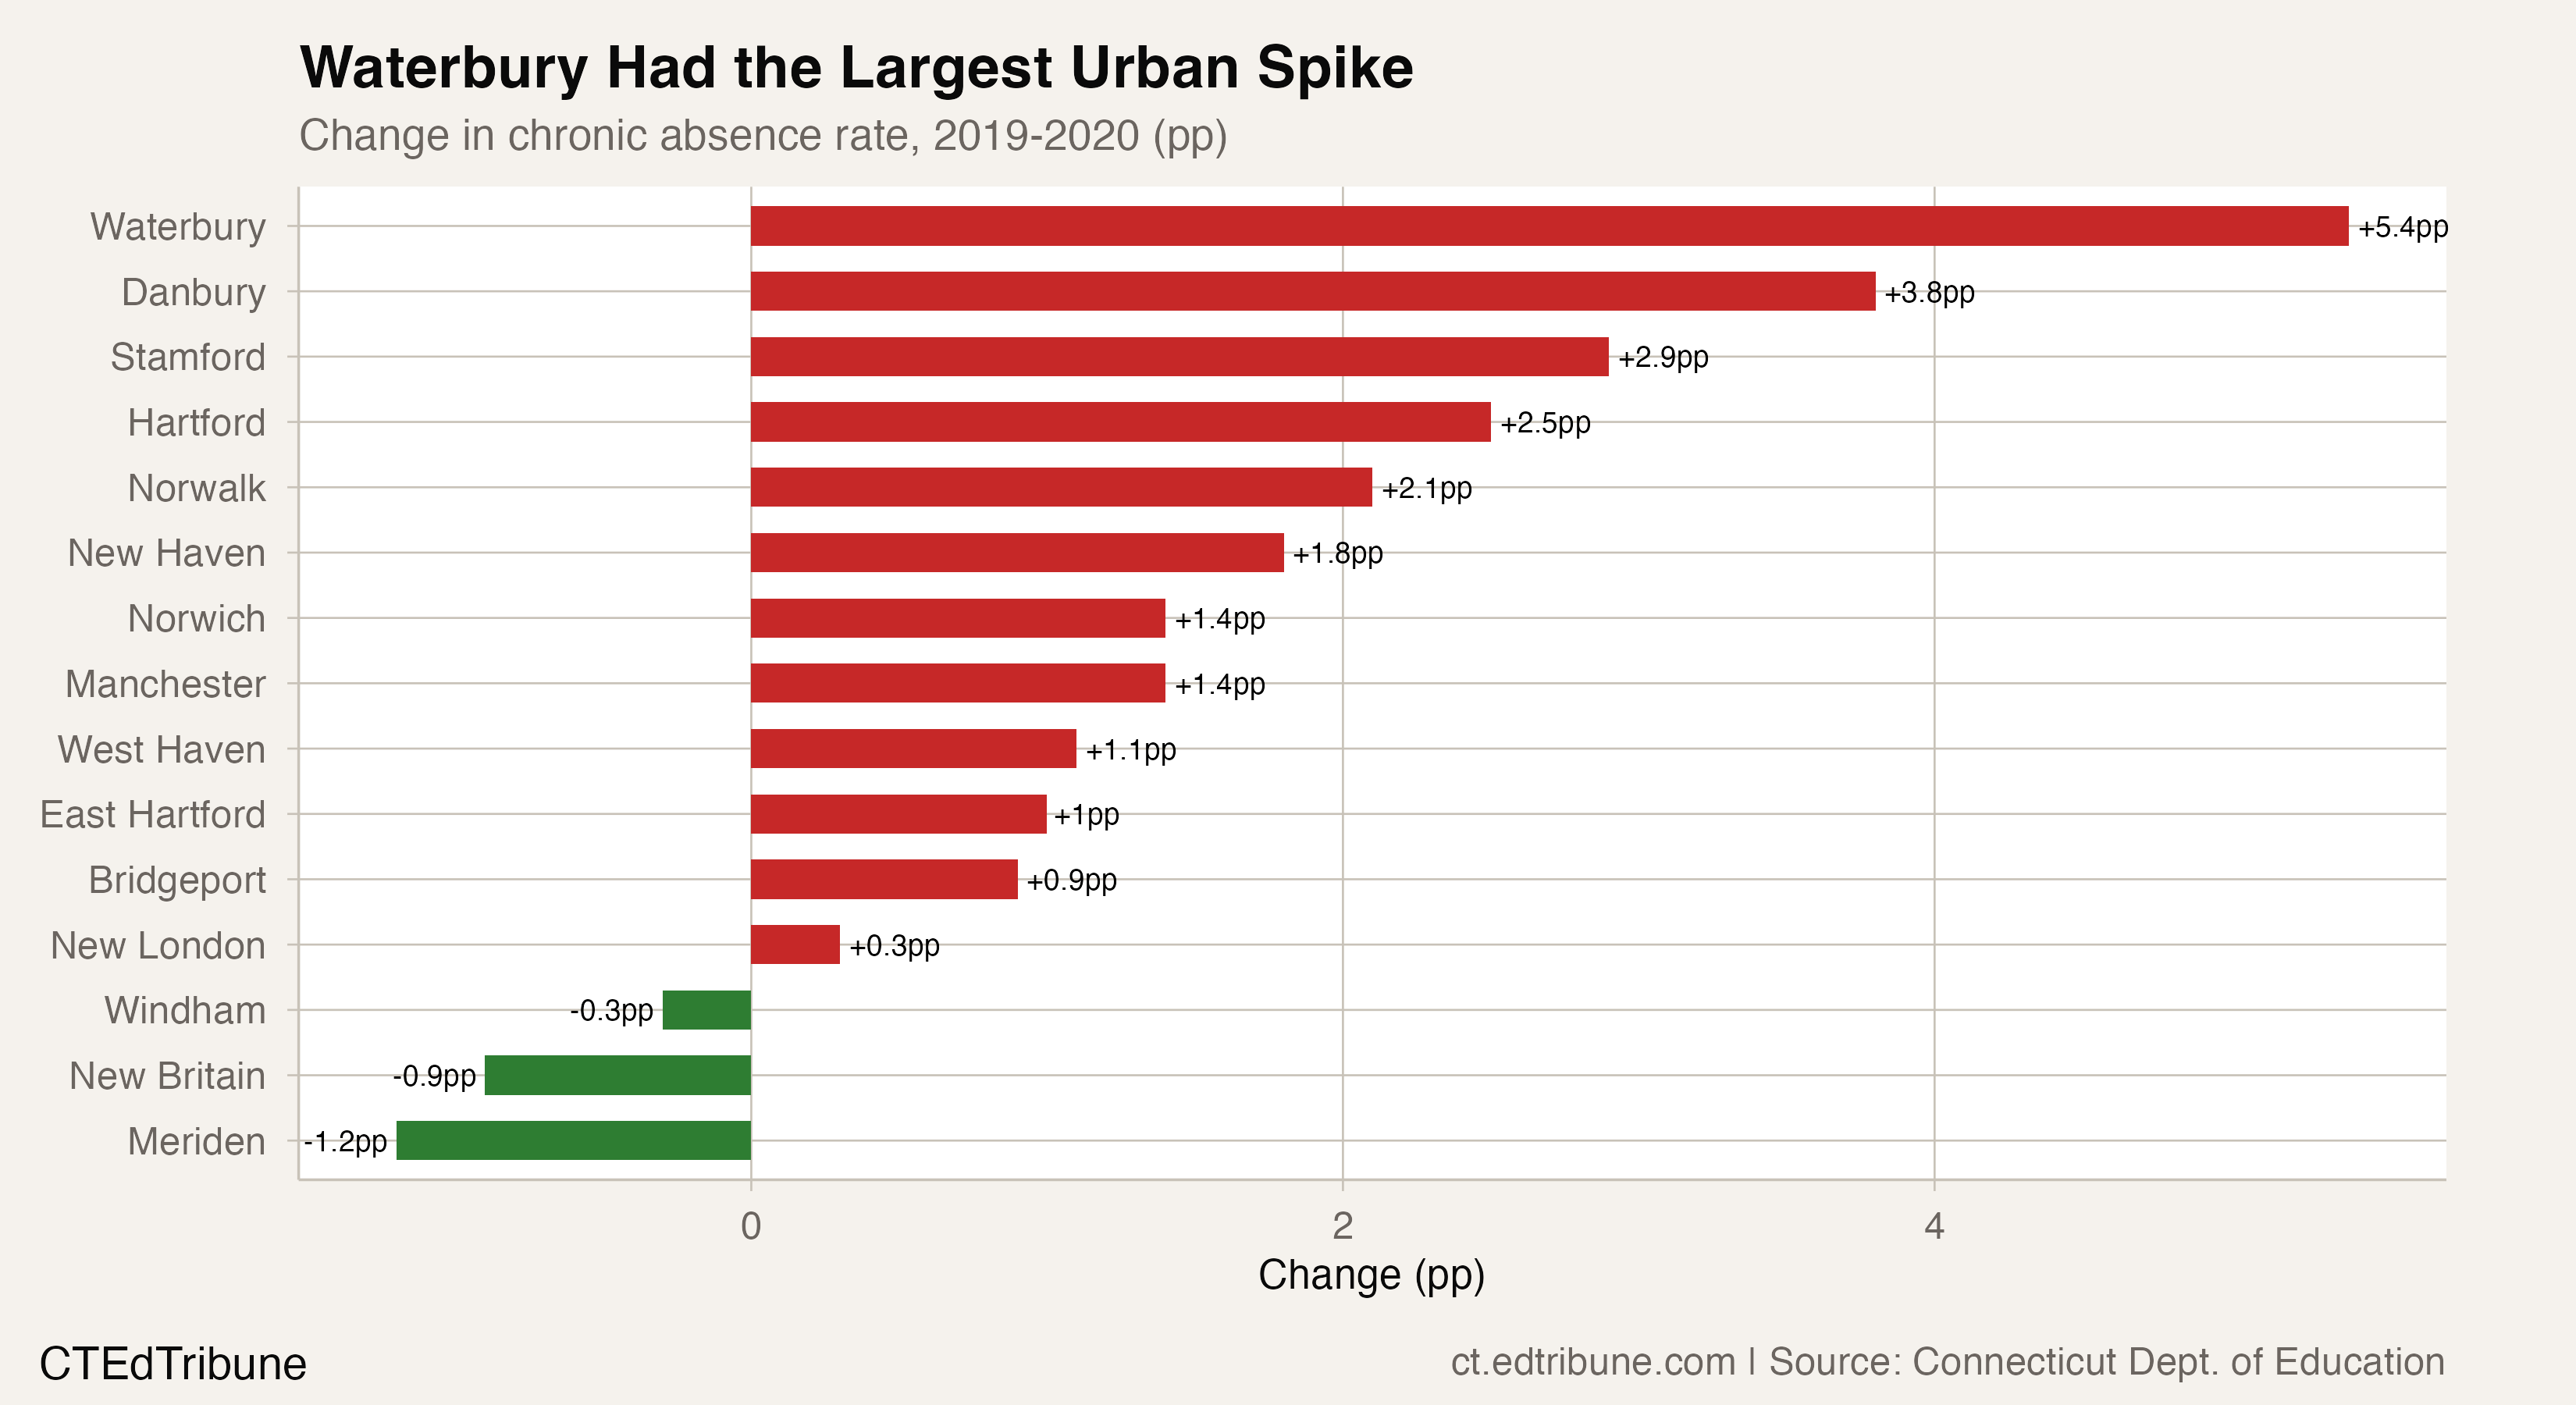
Waterbury's chronic absenteeism proxy rate jumped 5.5 points to 21% in the COVID-shortened 2020 — the largest single-year spike among Alliance Districts.
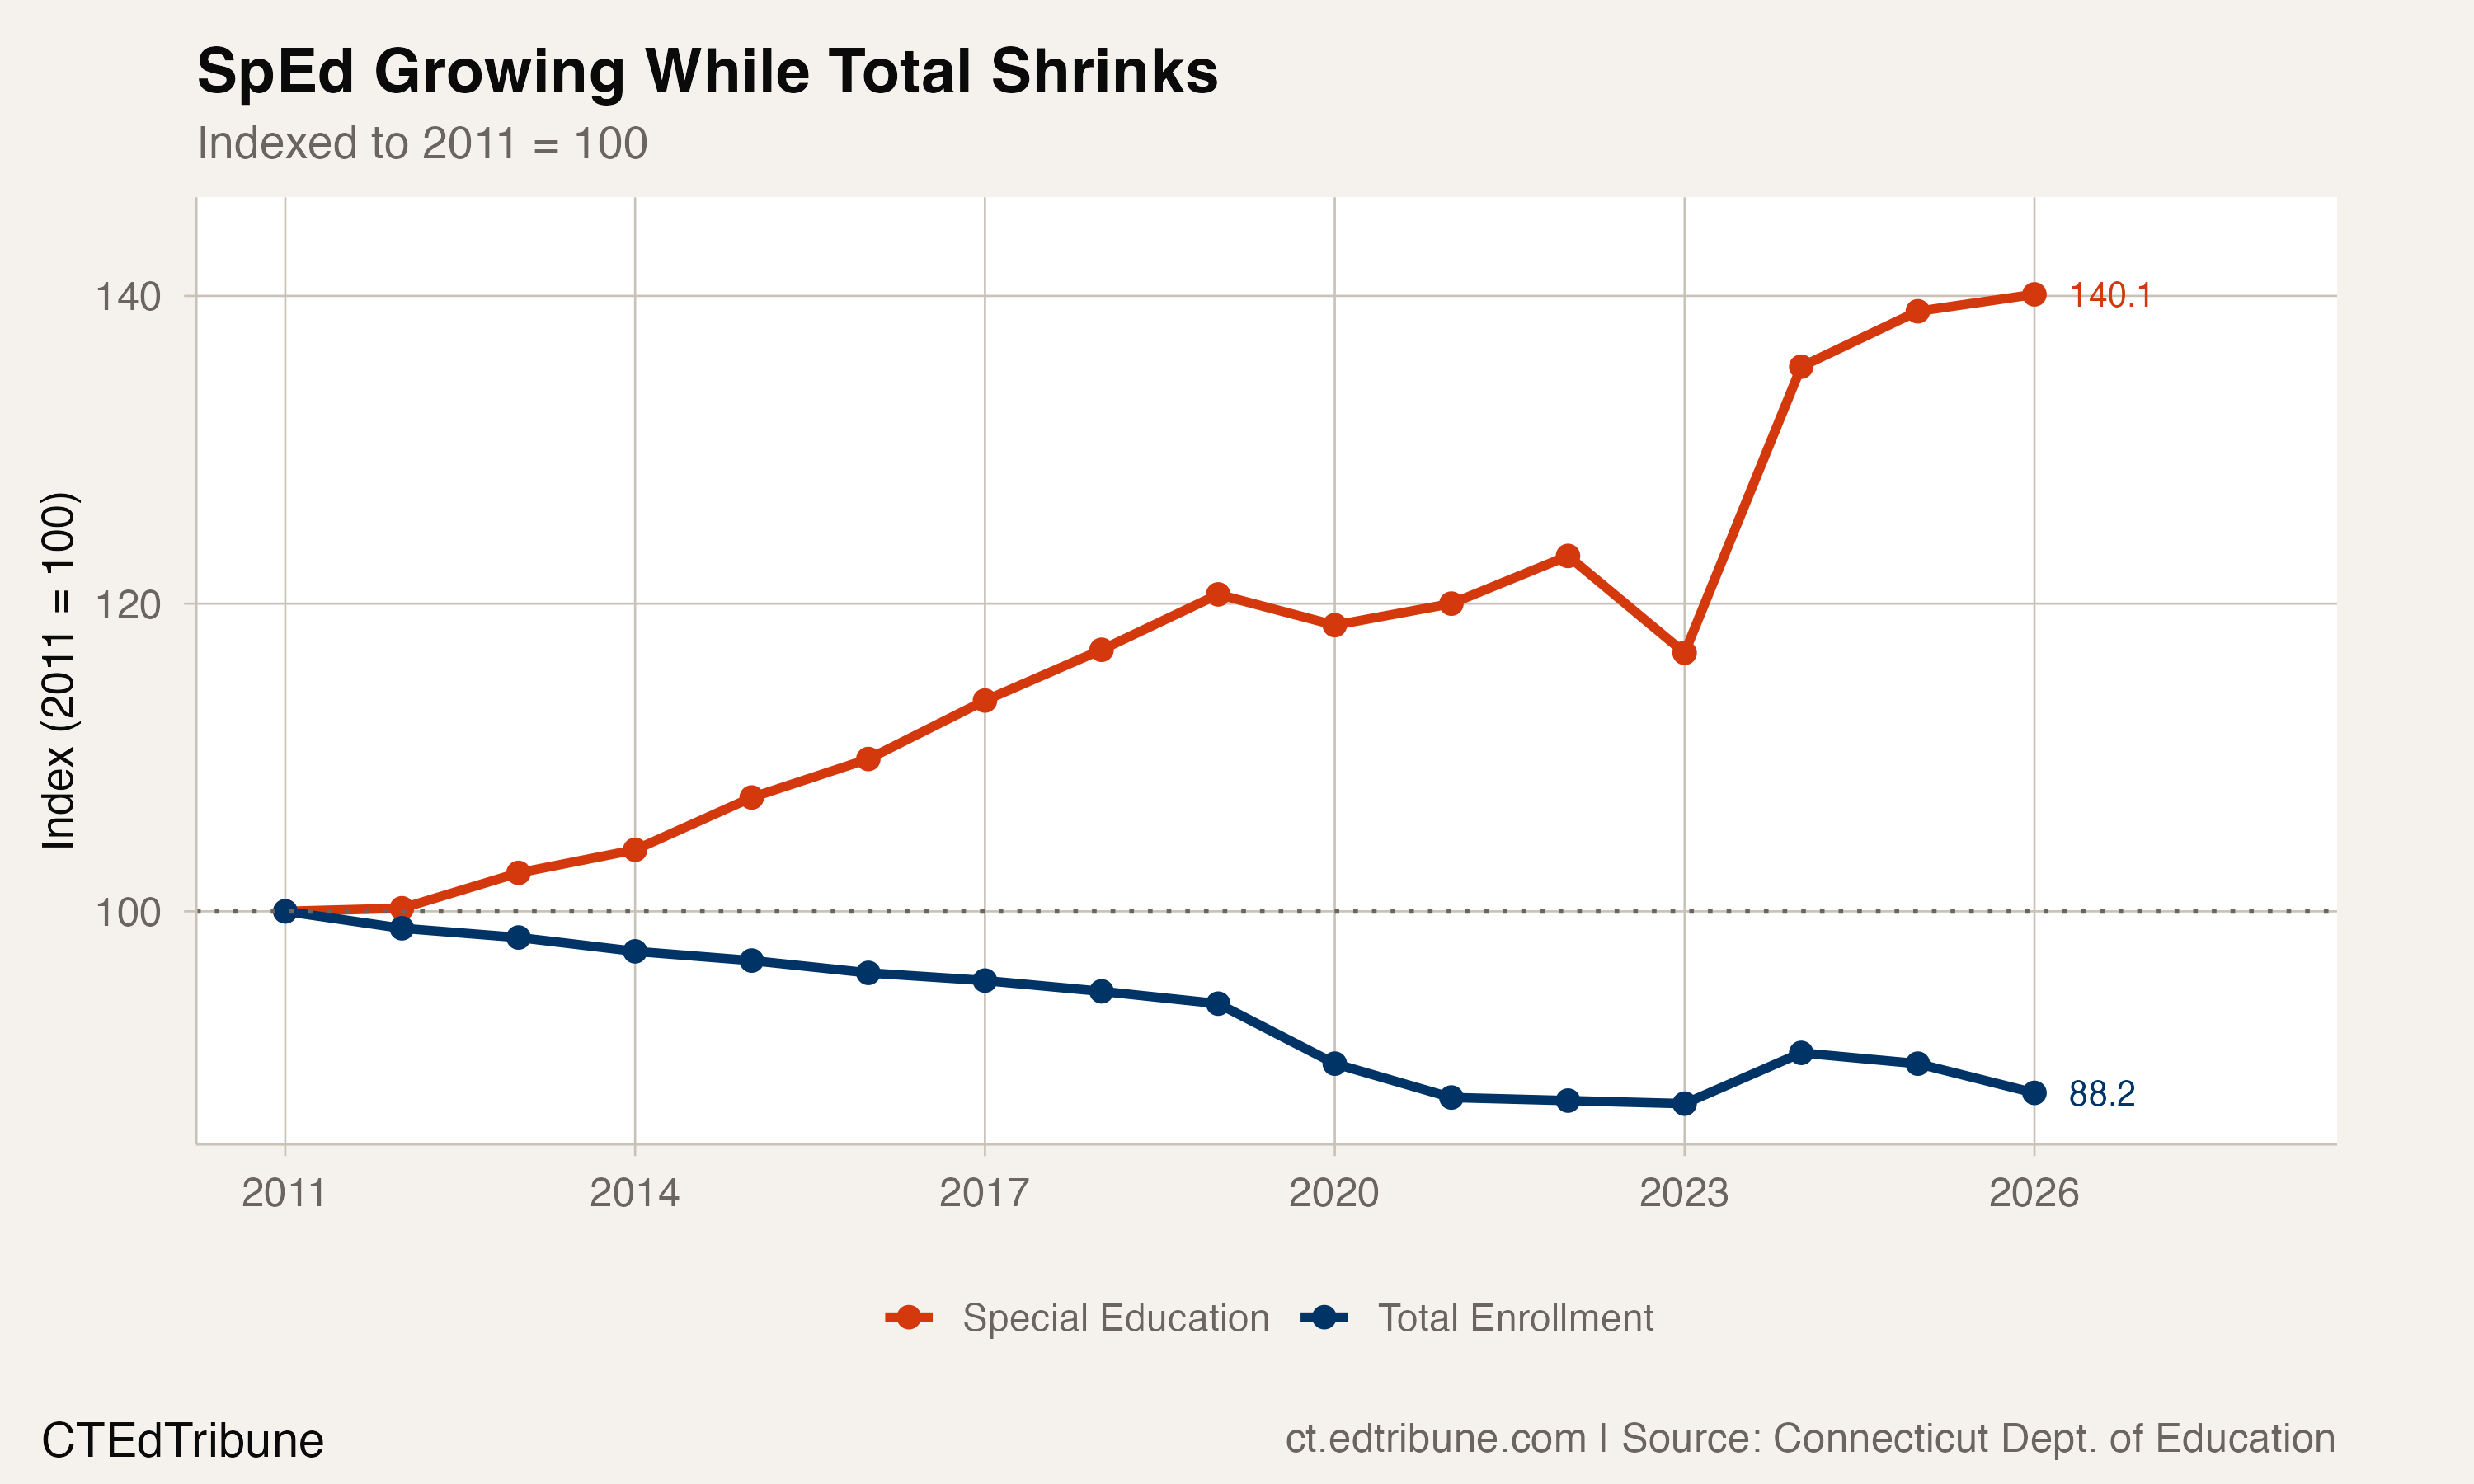
Special education enrollment grew 40% over 15 years while total enrollment fell 12%, creating a structural mismatch that a $70M funding boost has not resolved.
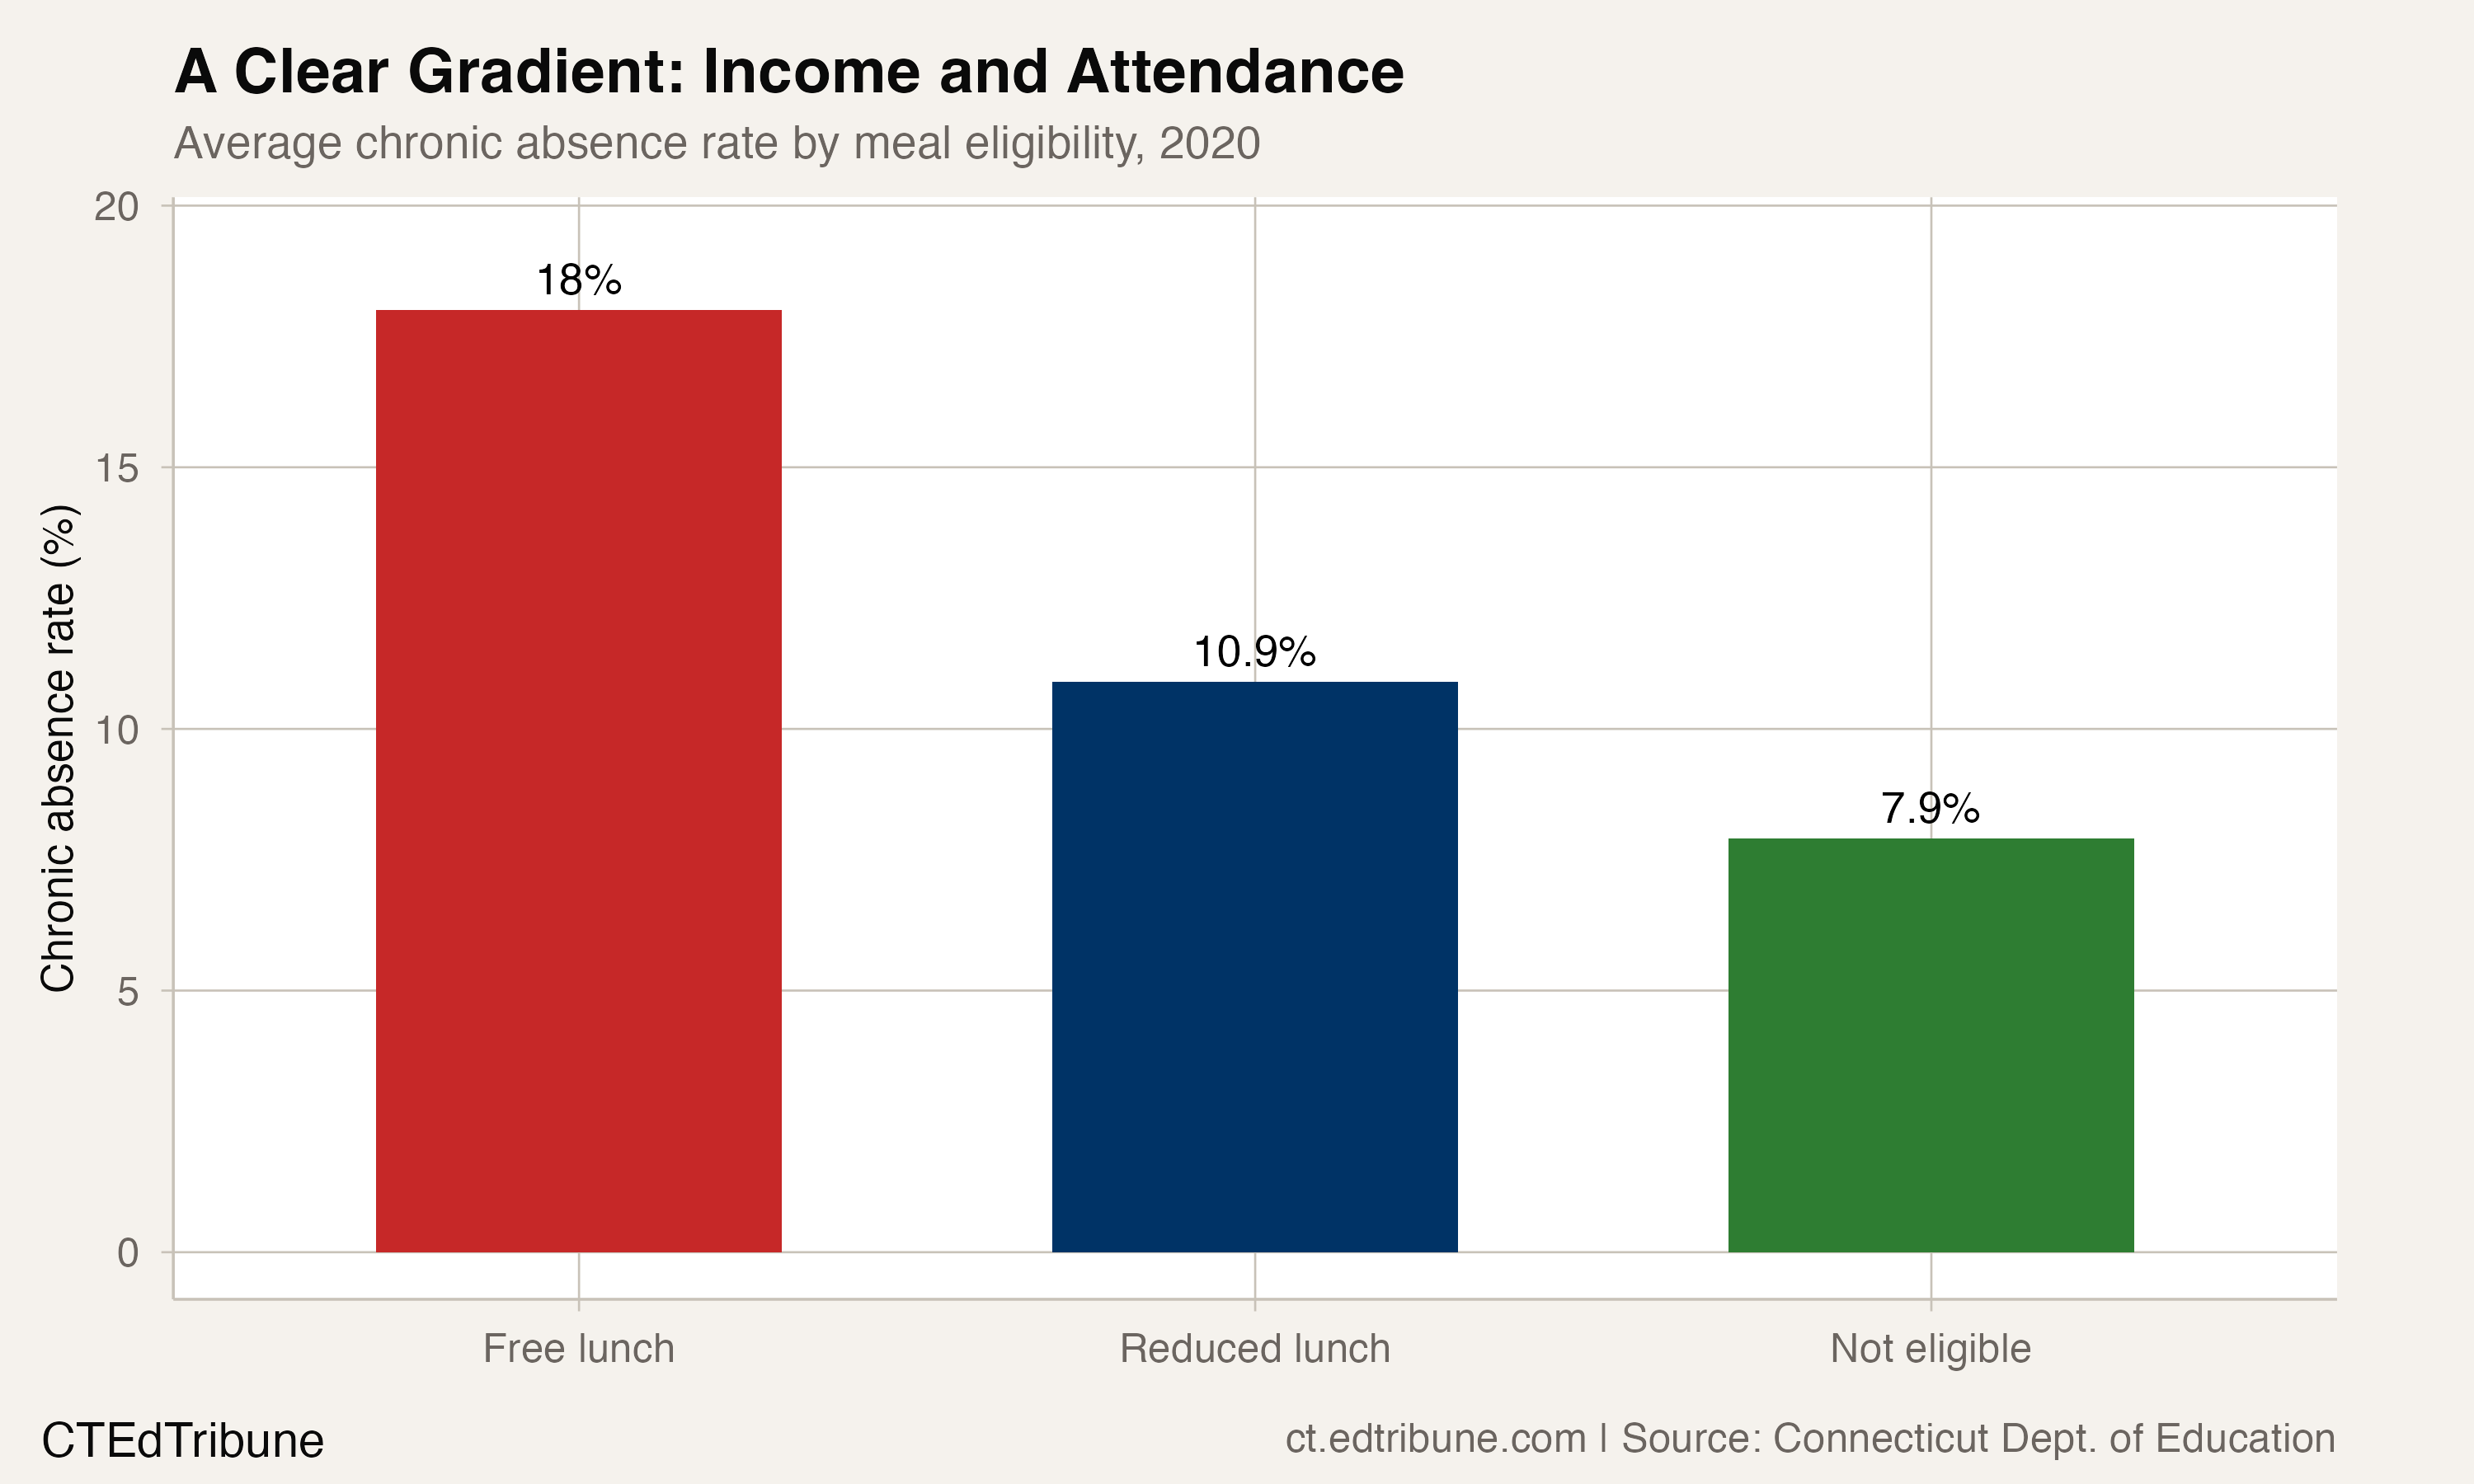
Students eligible for free lunch averaged an 18% chronic absence rate compared to 7.9% for non-eligible peers in 2020 — a 10.1-point gap that narrowed only because wealthier students got worse.
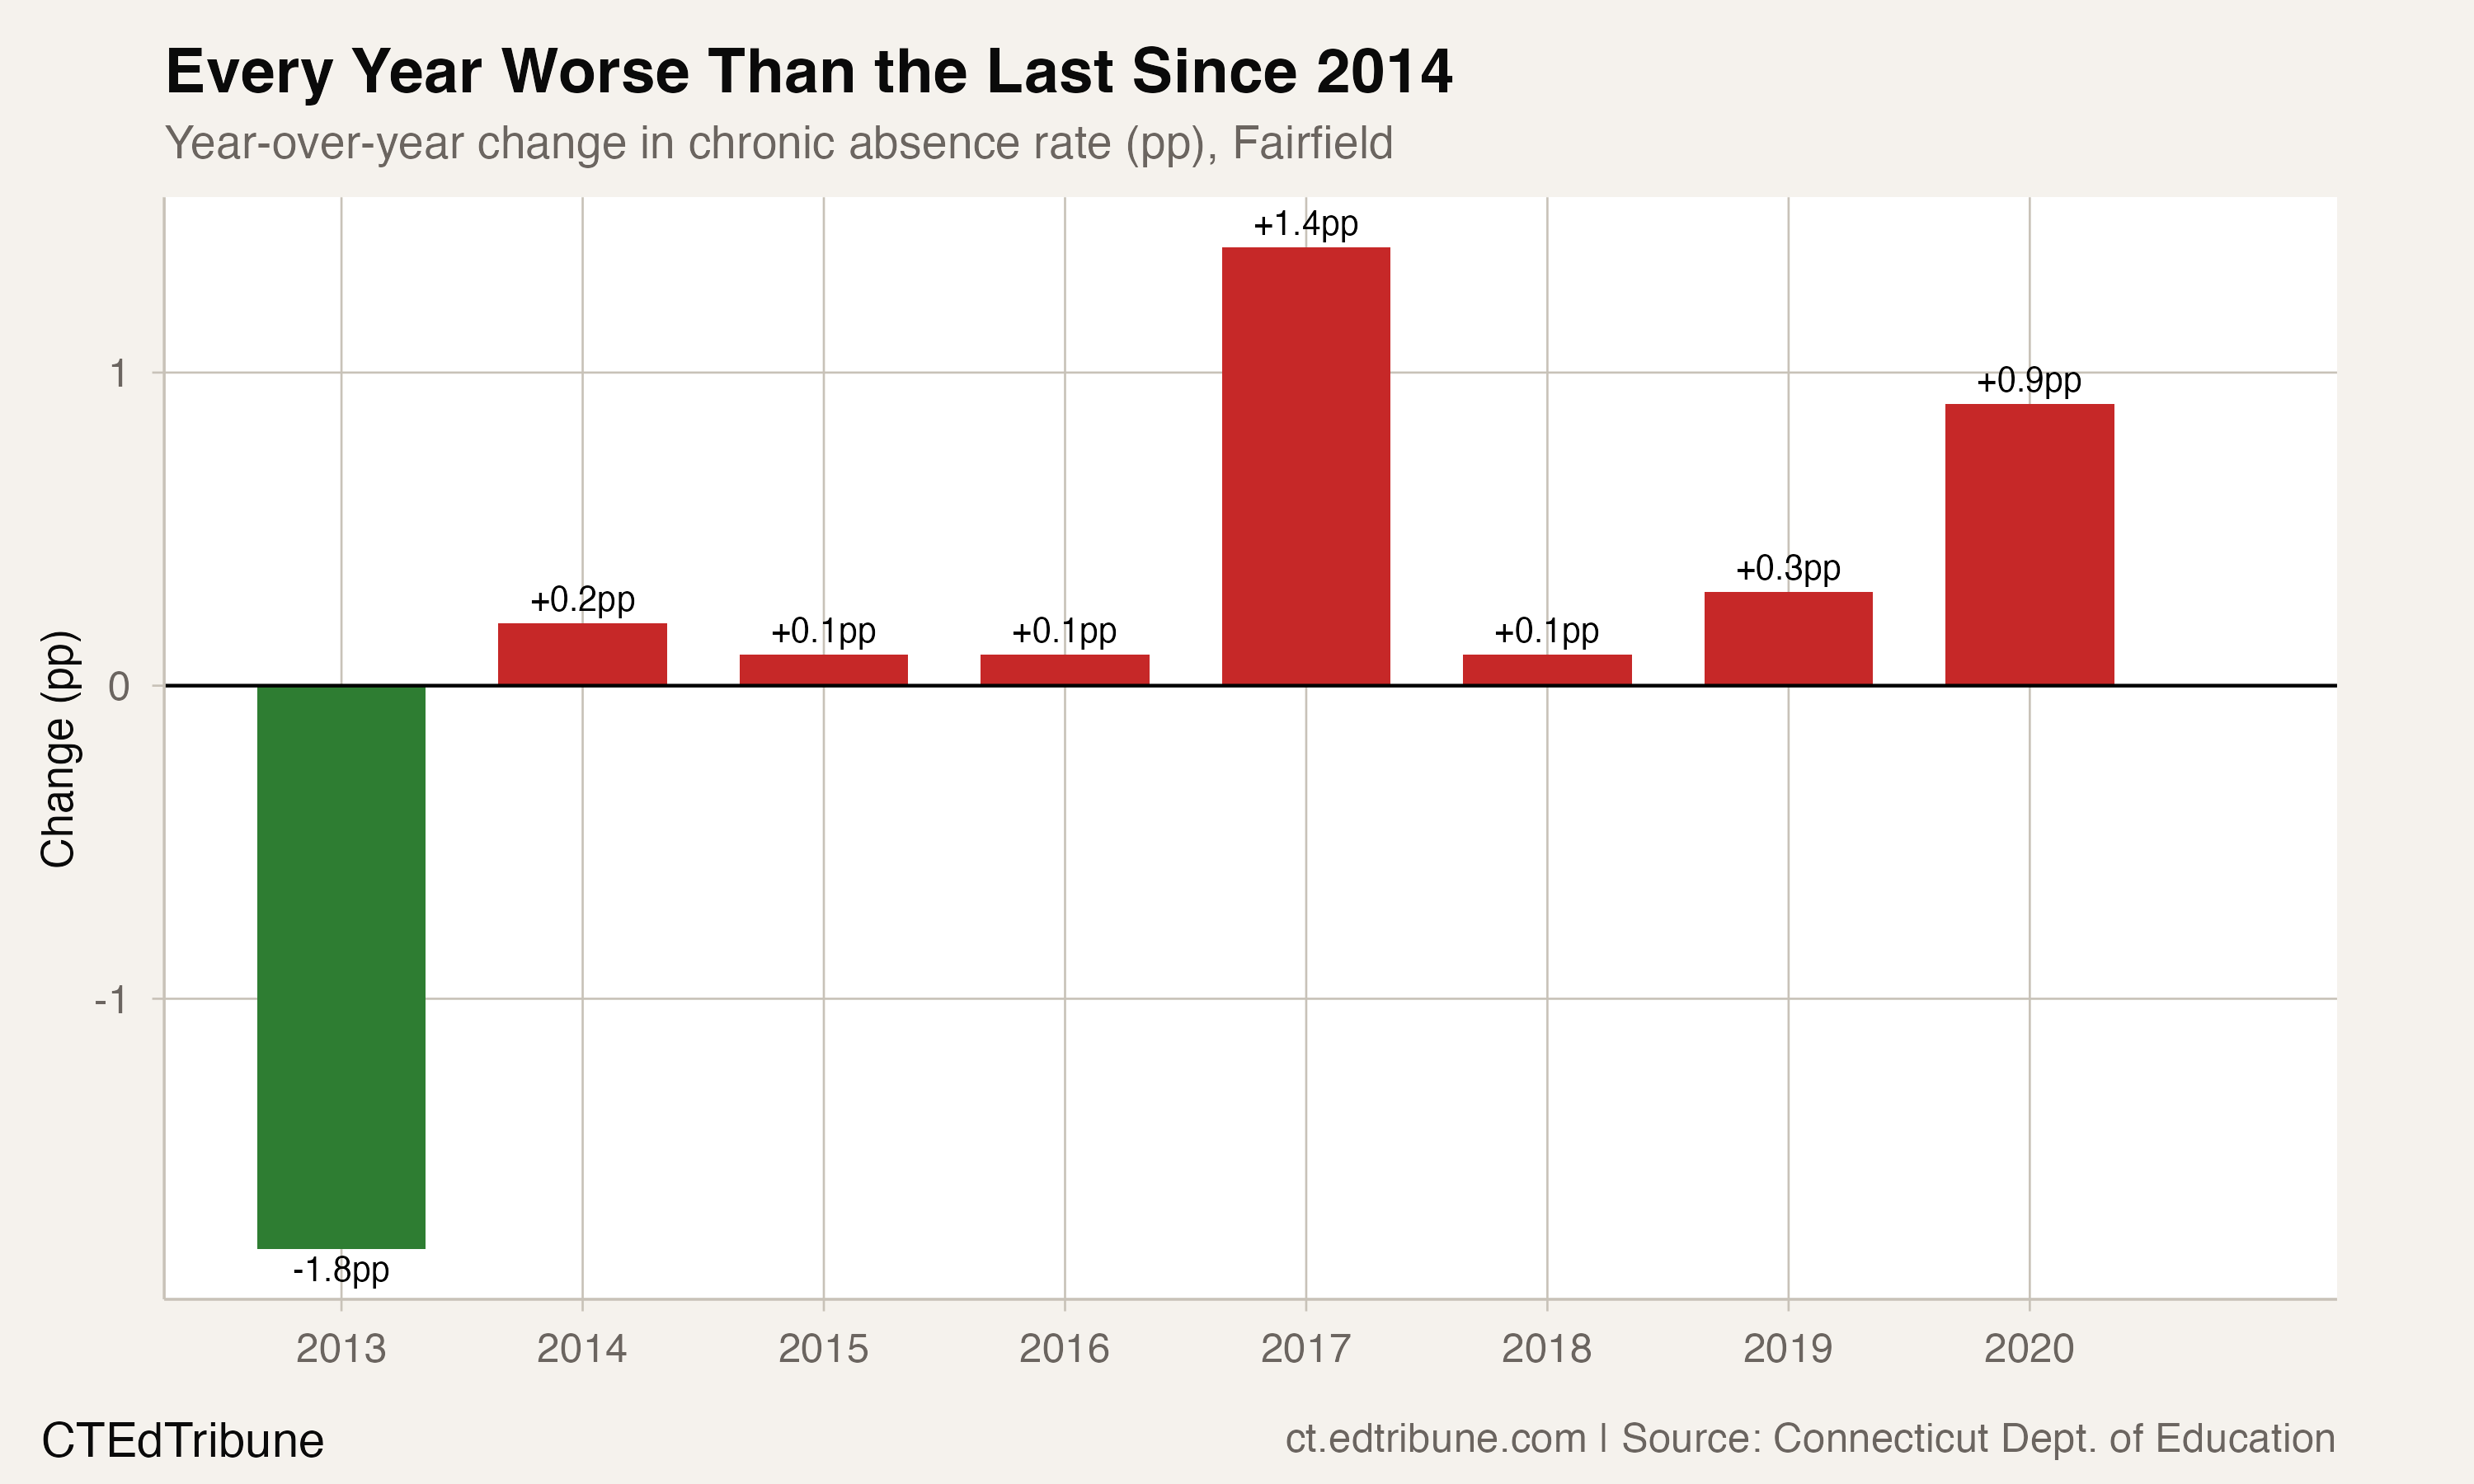
Fairfield School District's chronic absence rate remains well below Connecticut's average, but it increased every year from 2014 to 2020 -- the longest worsening streak in the state.
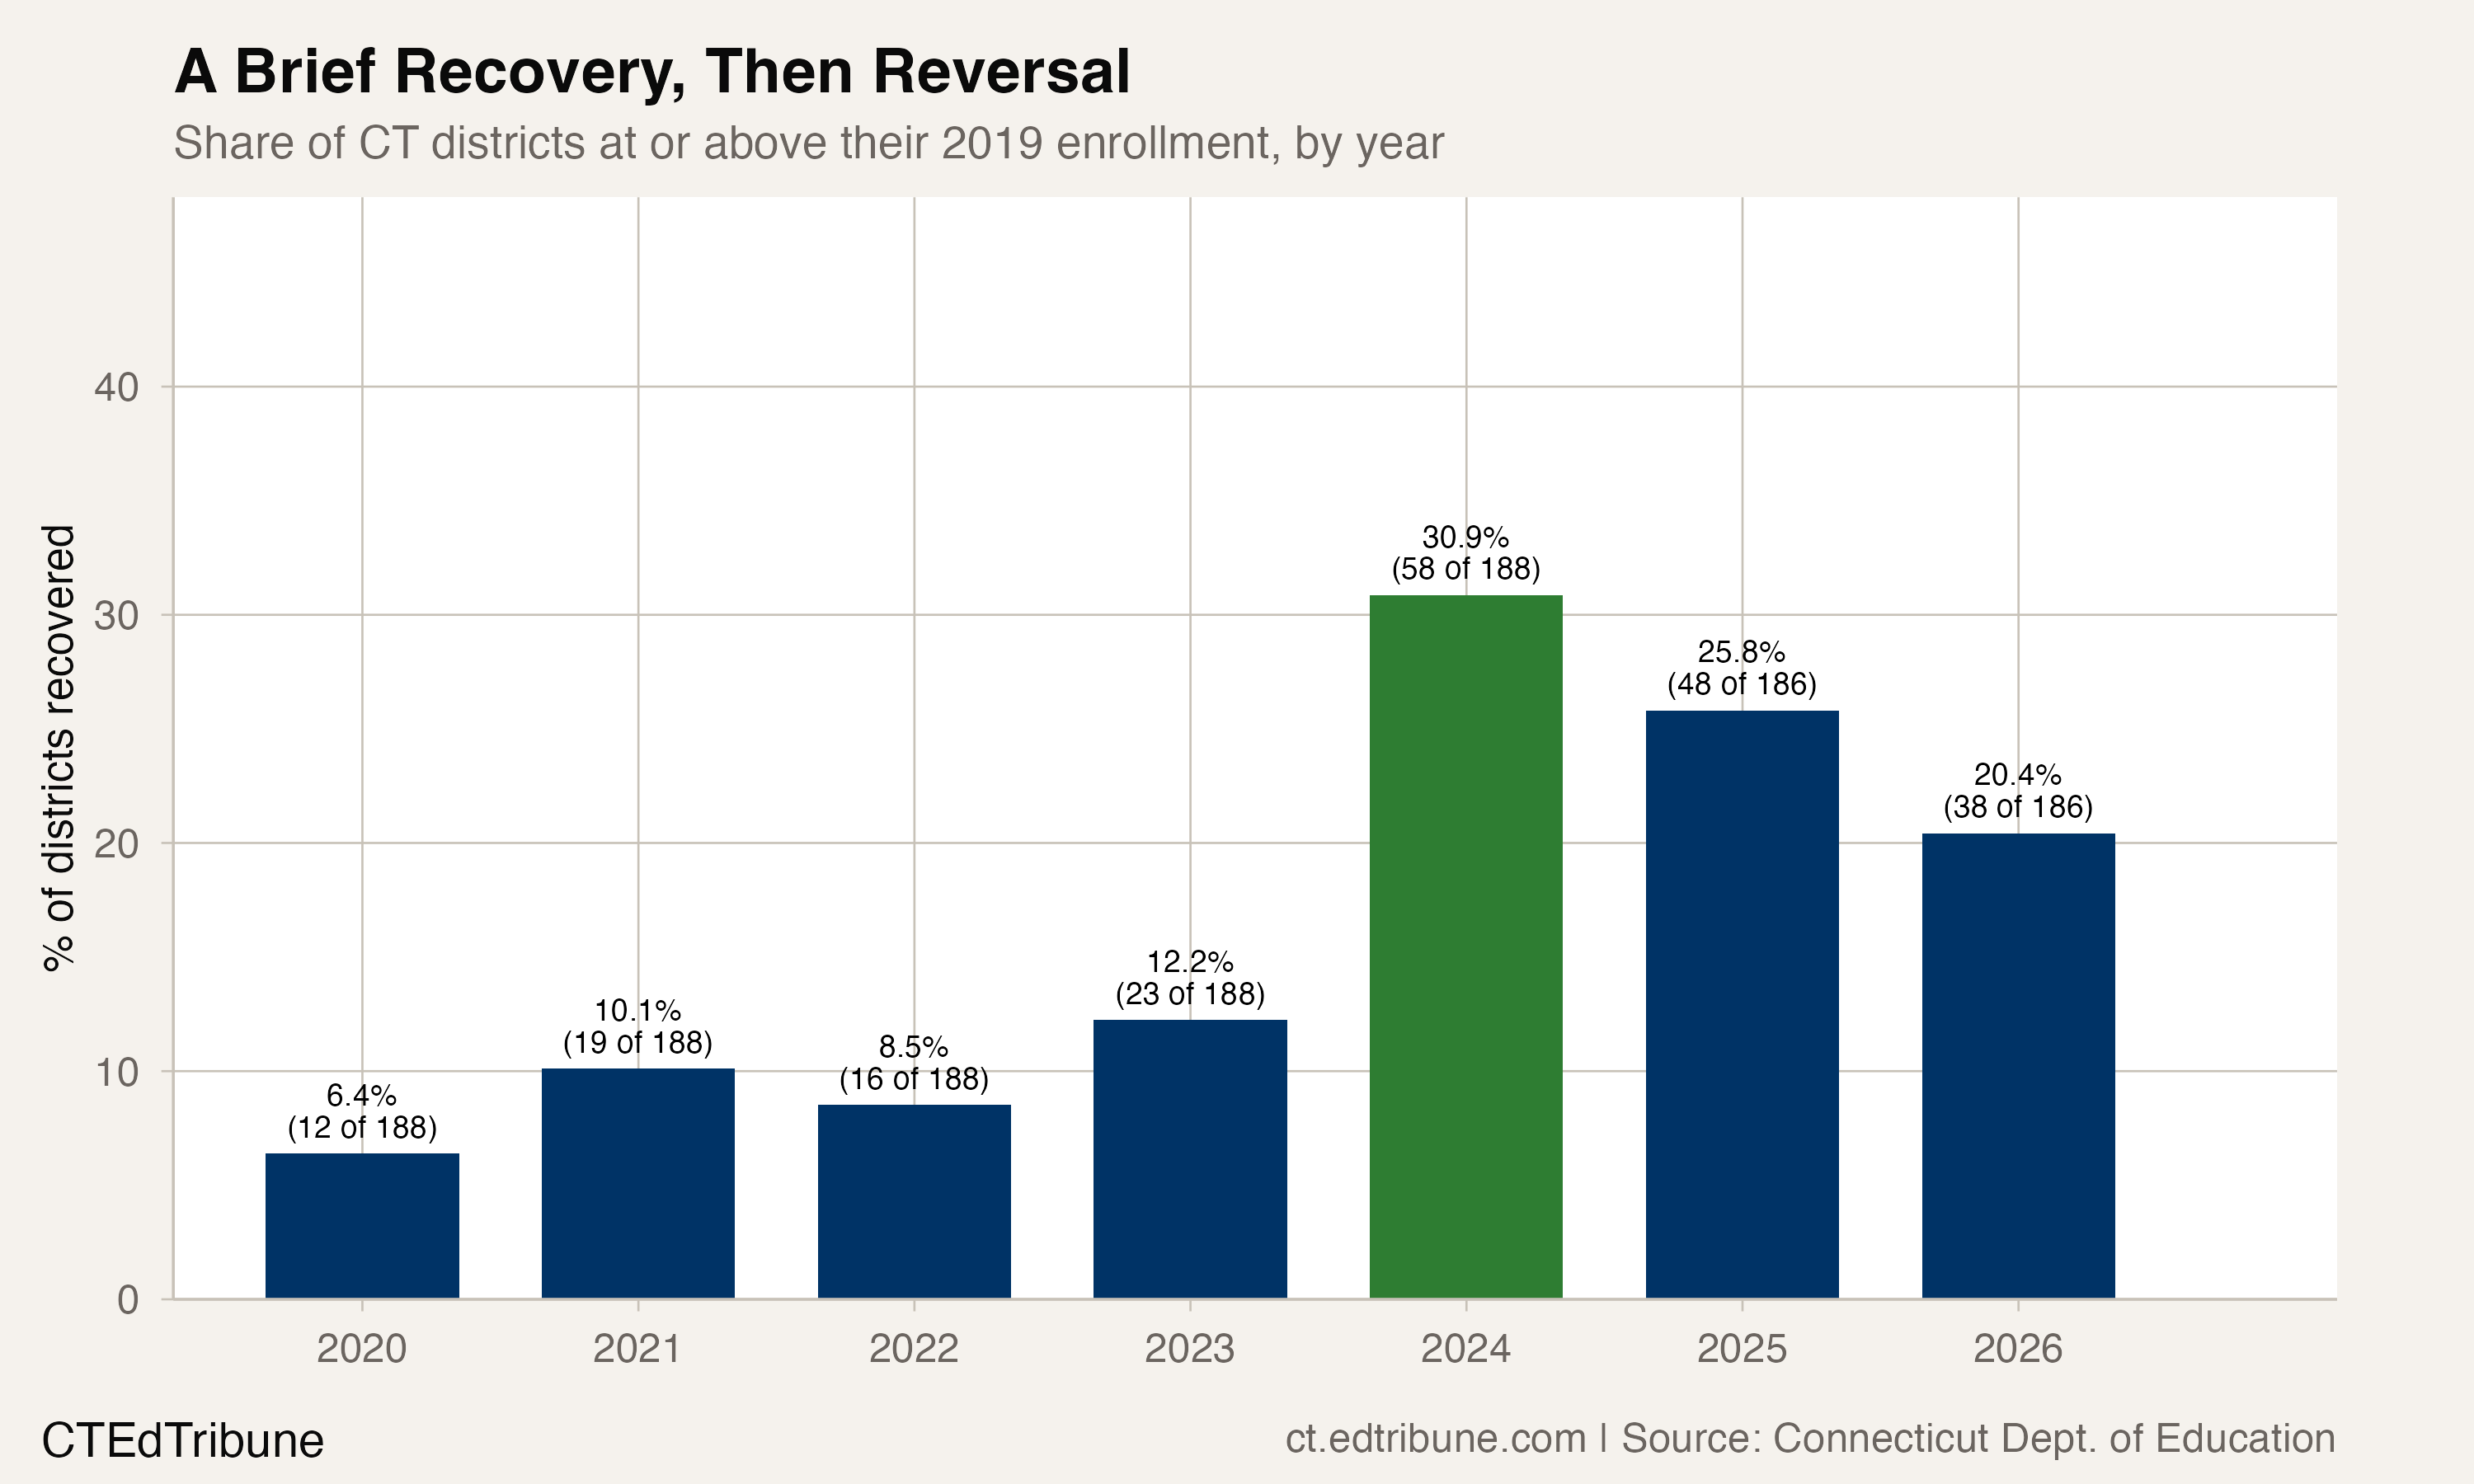
Only 43 of 197 Connecticut districts have returned to pre-pandemic enrollment. The state is 32,851 students below 2019 levels, with the largest districts hit hardest.