While headlines focus on the districts struggling most with chronic absenteeism, a quieter story runs beneath the data: 38 Connecticut districts stayed below the statewide average every single year from 2012 through 2020.
Not most years. Every year. Including the pandemic-shortened 2019-20, when the statewide rate hit its highest level on record.
What "consistently low" looks like
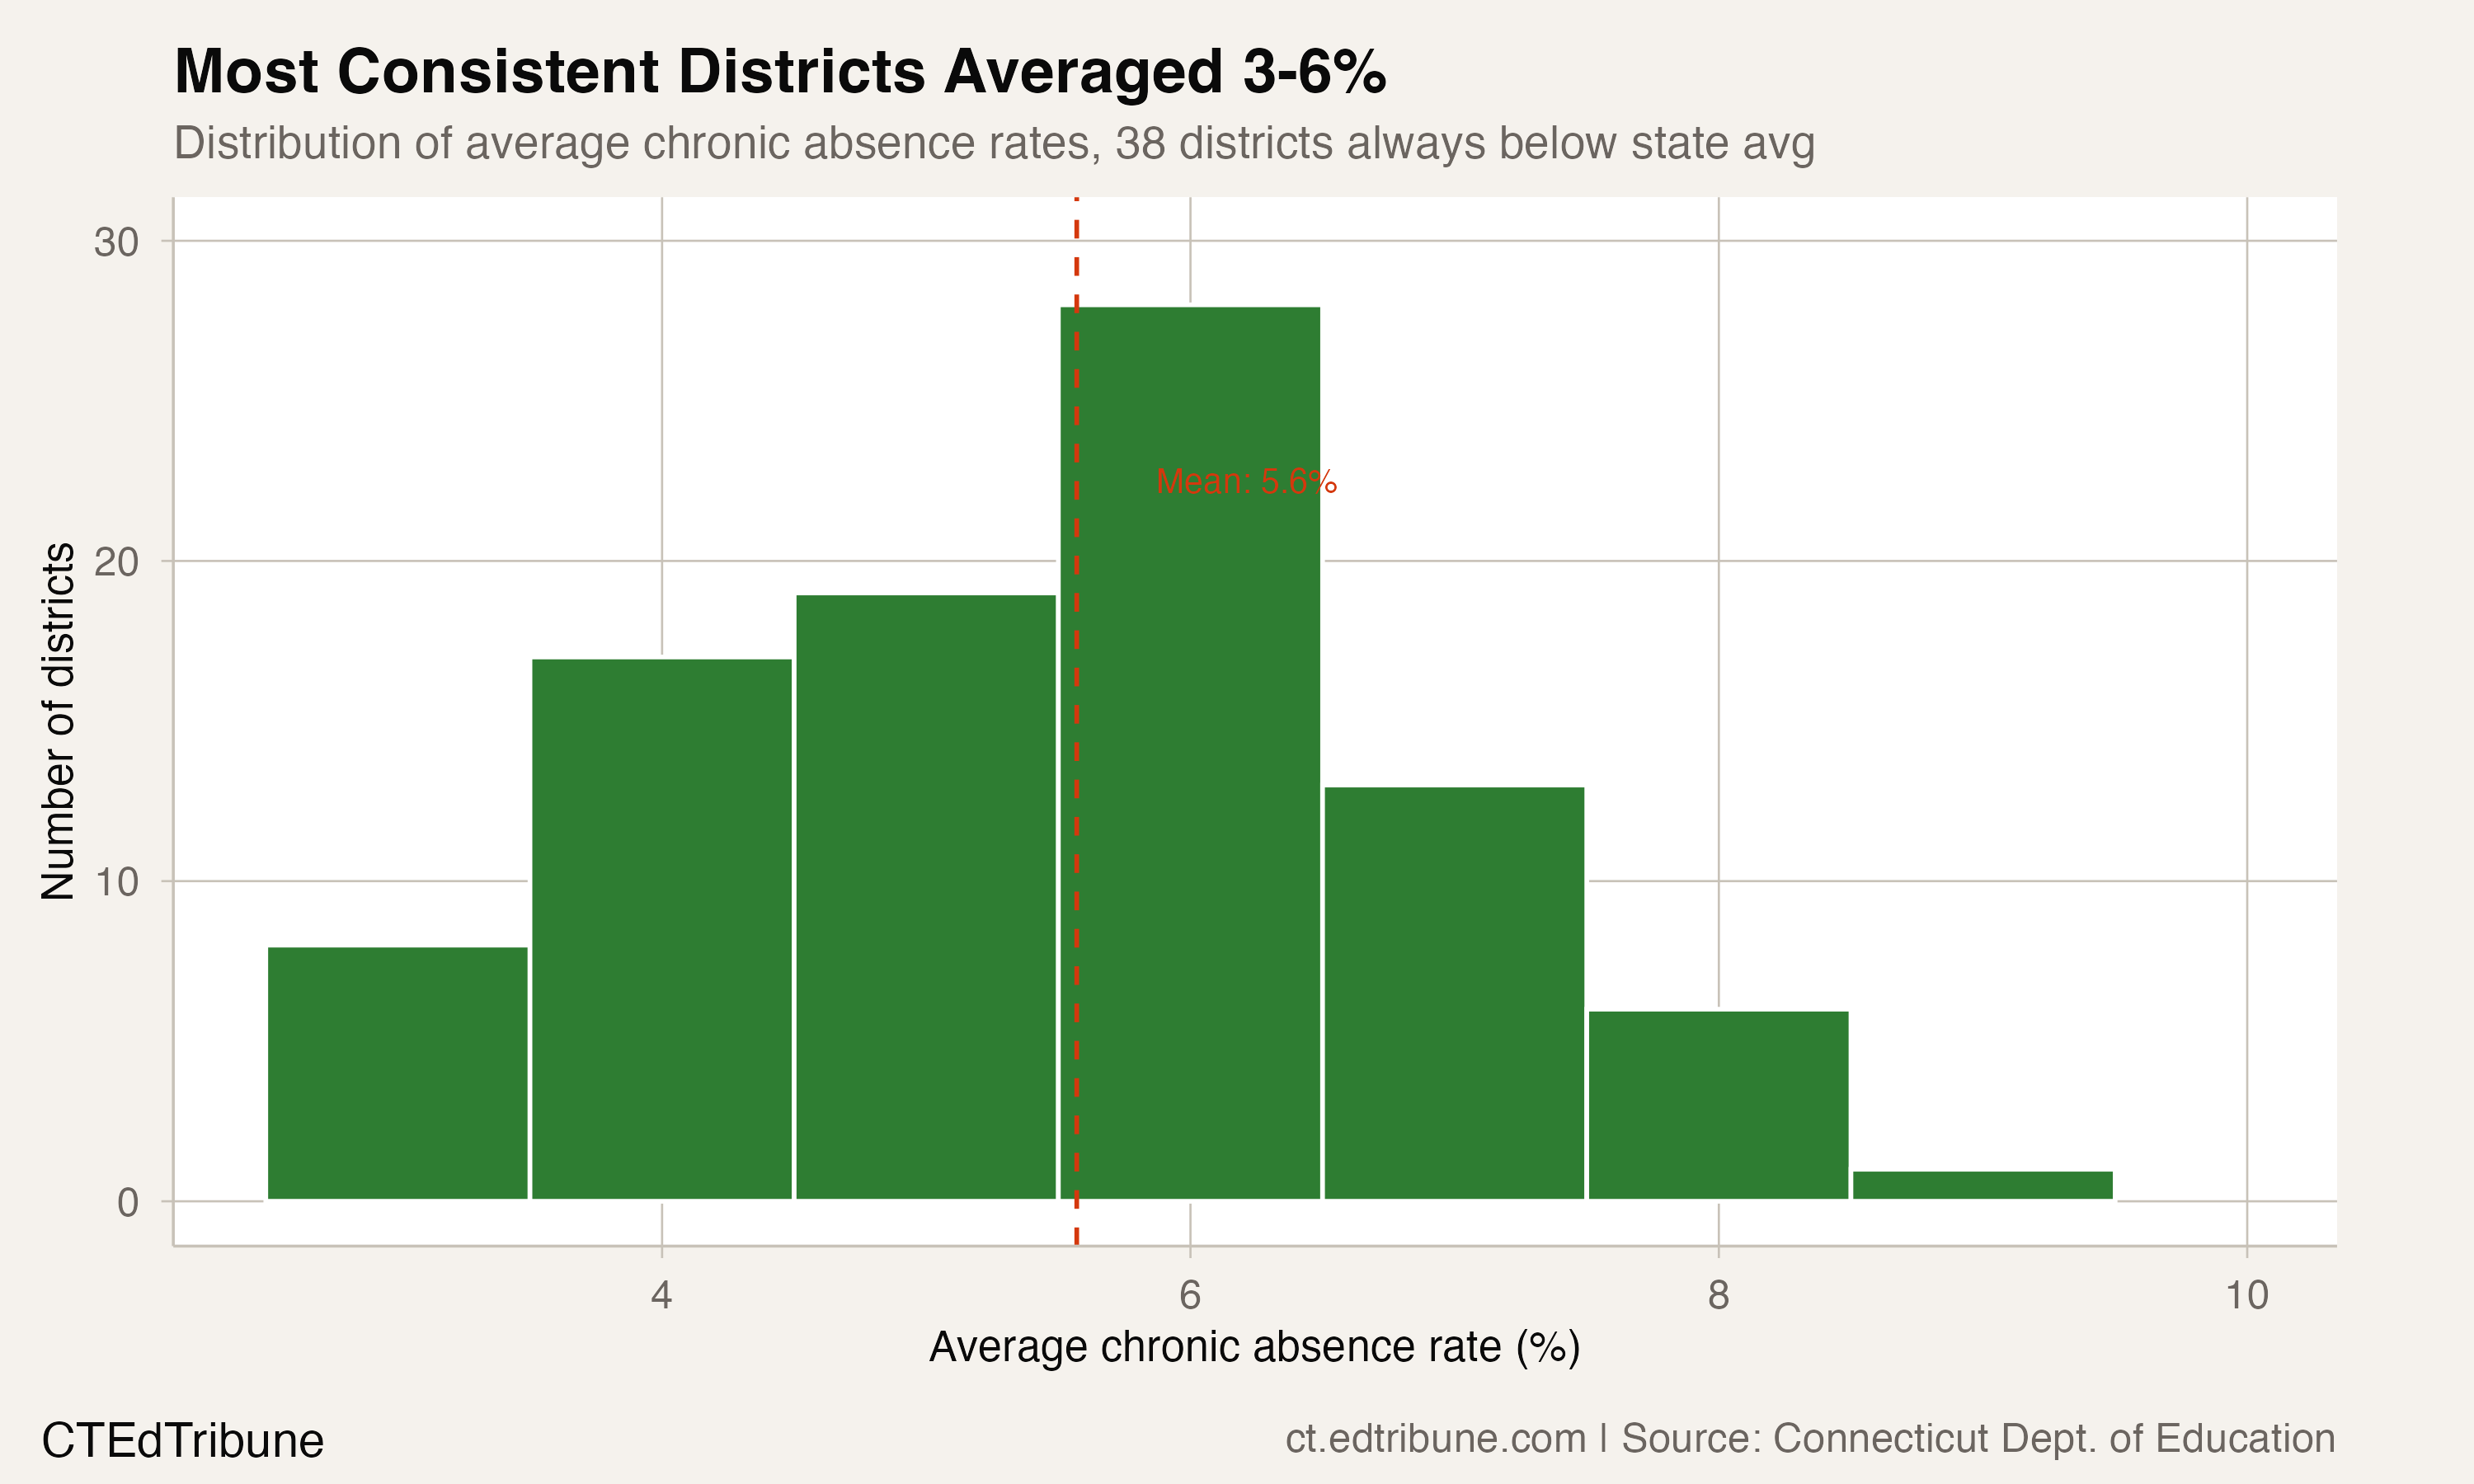
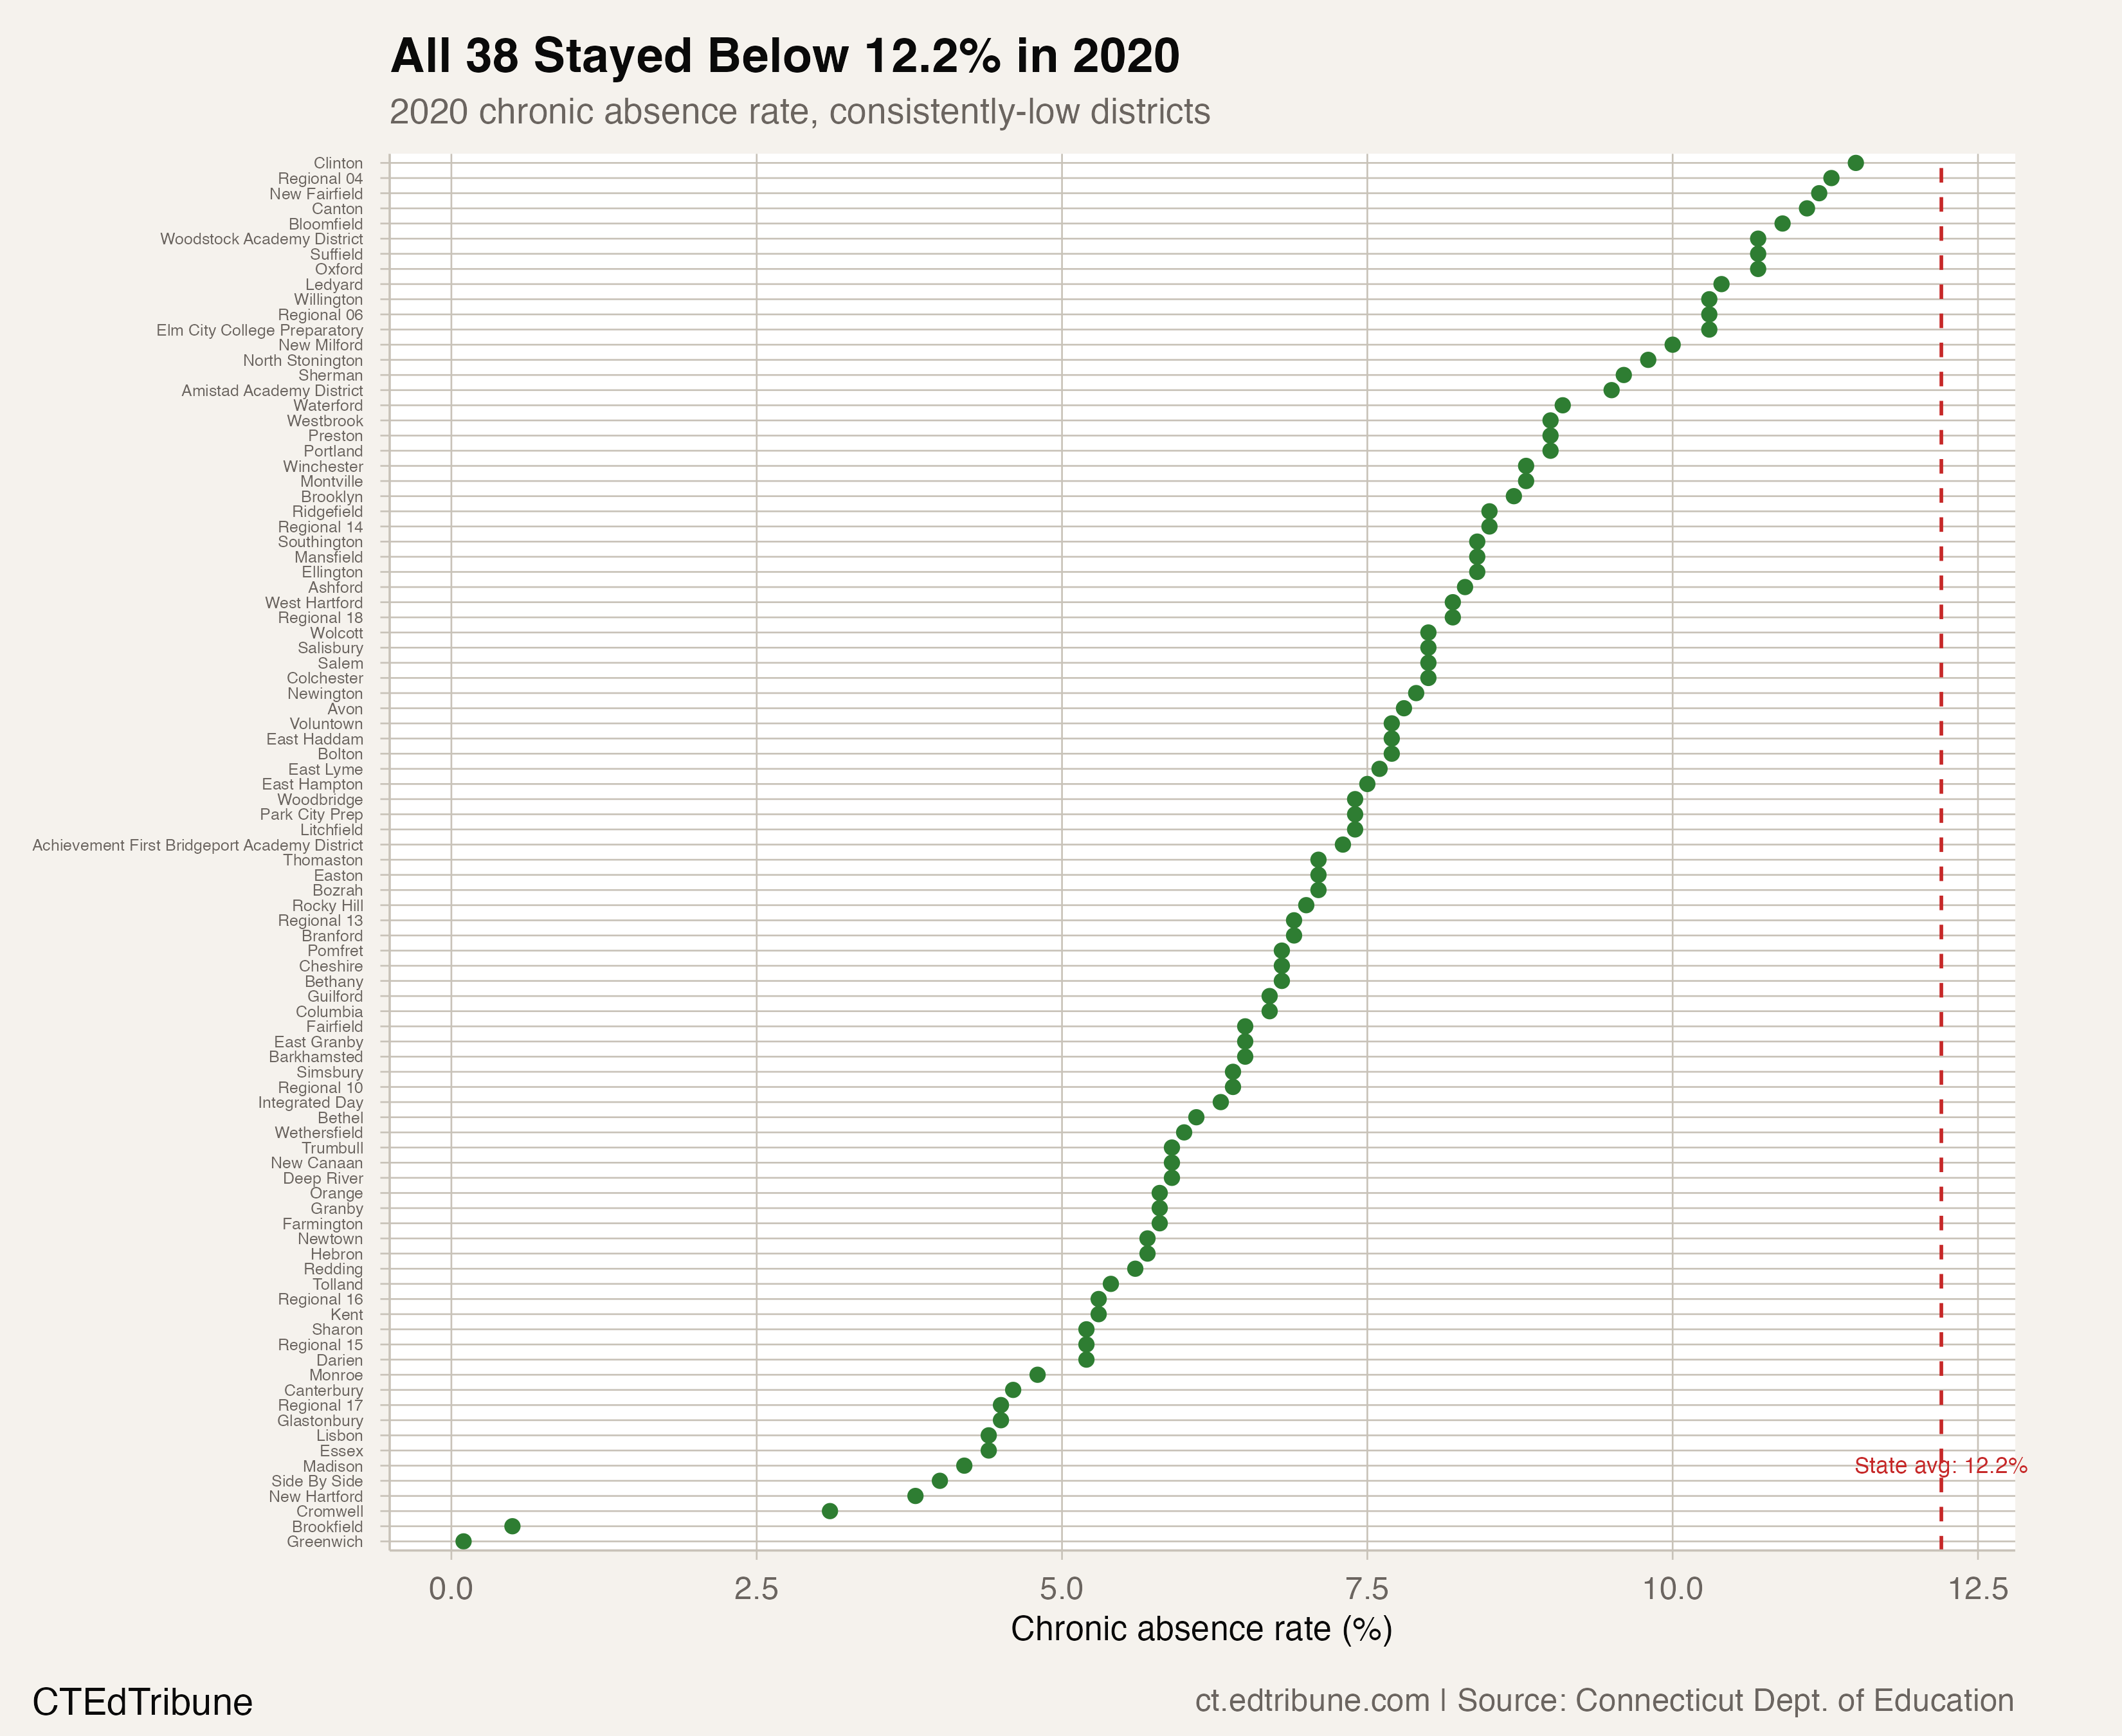
Among the 38 districts that never exceeded the state average in any of their recorded years (seven or more years of data with the total subgroup), the average chronic absence rate was roughly 5.6%, about half the statewide figure. Even in 2020, when the state climbed to 12.2%, every one of these districts stayed below the line.
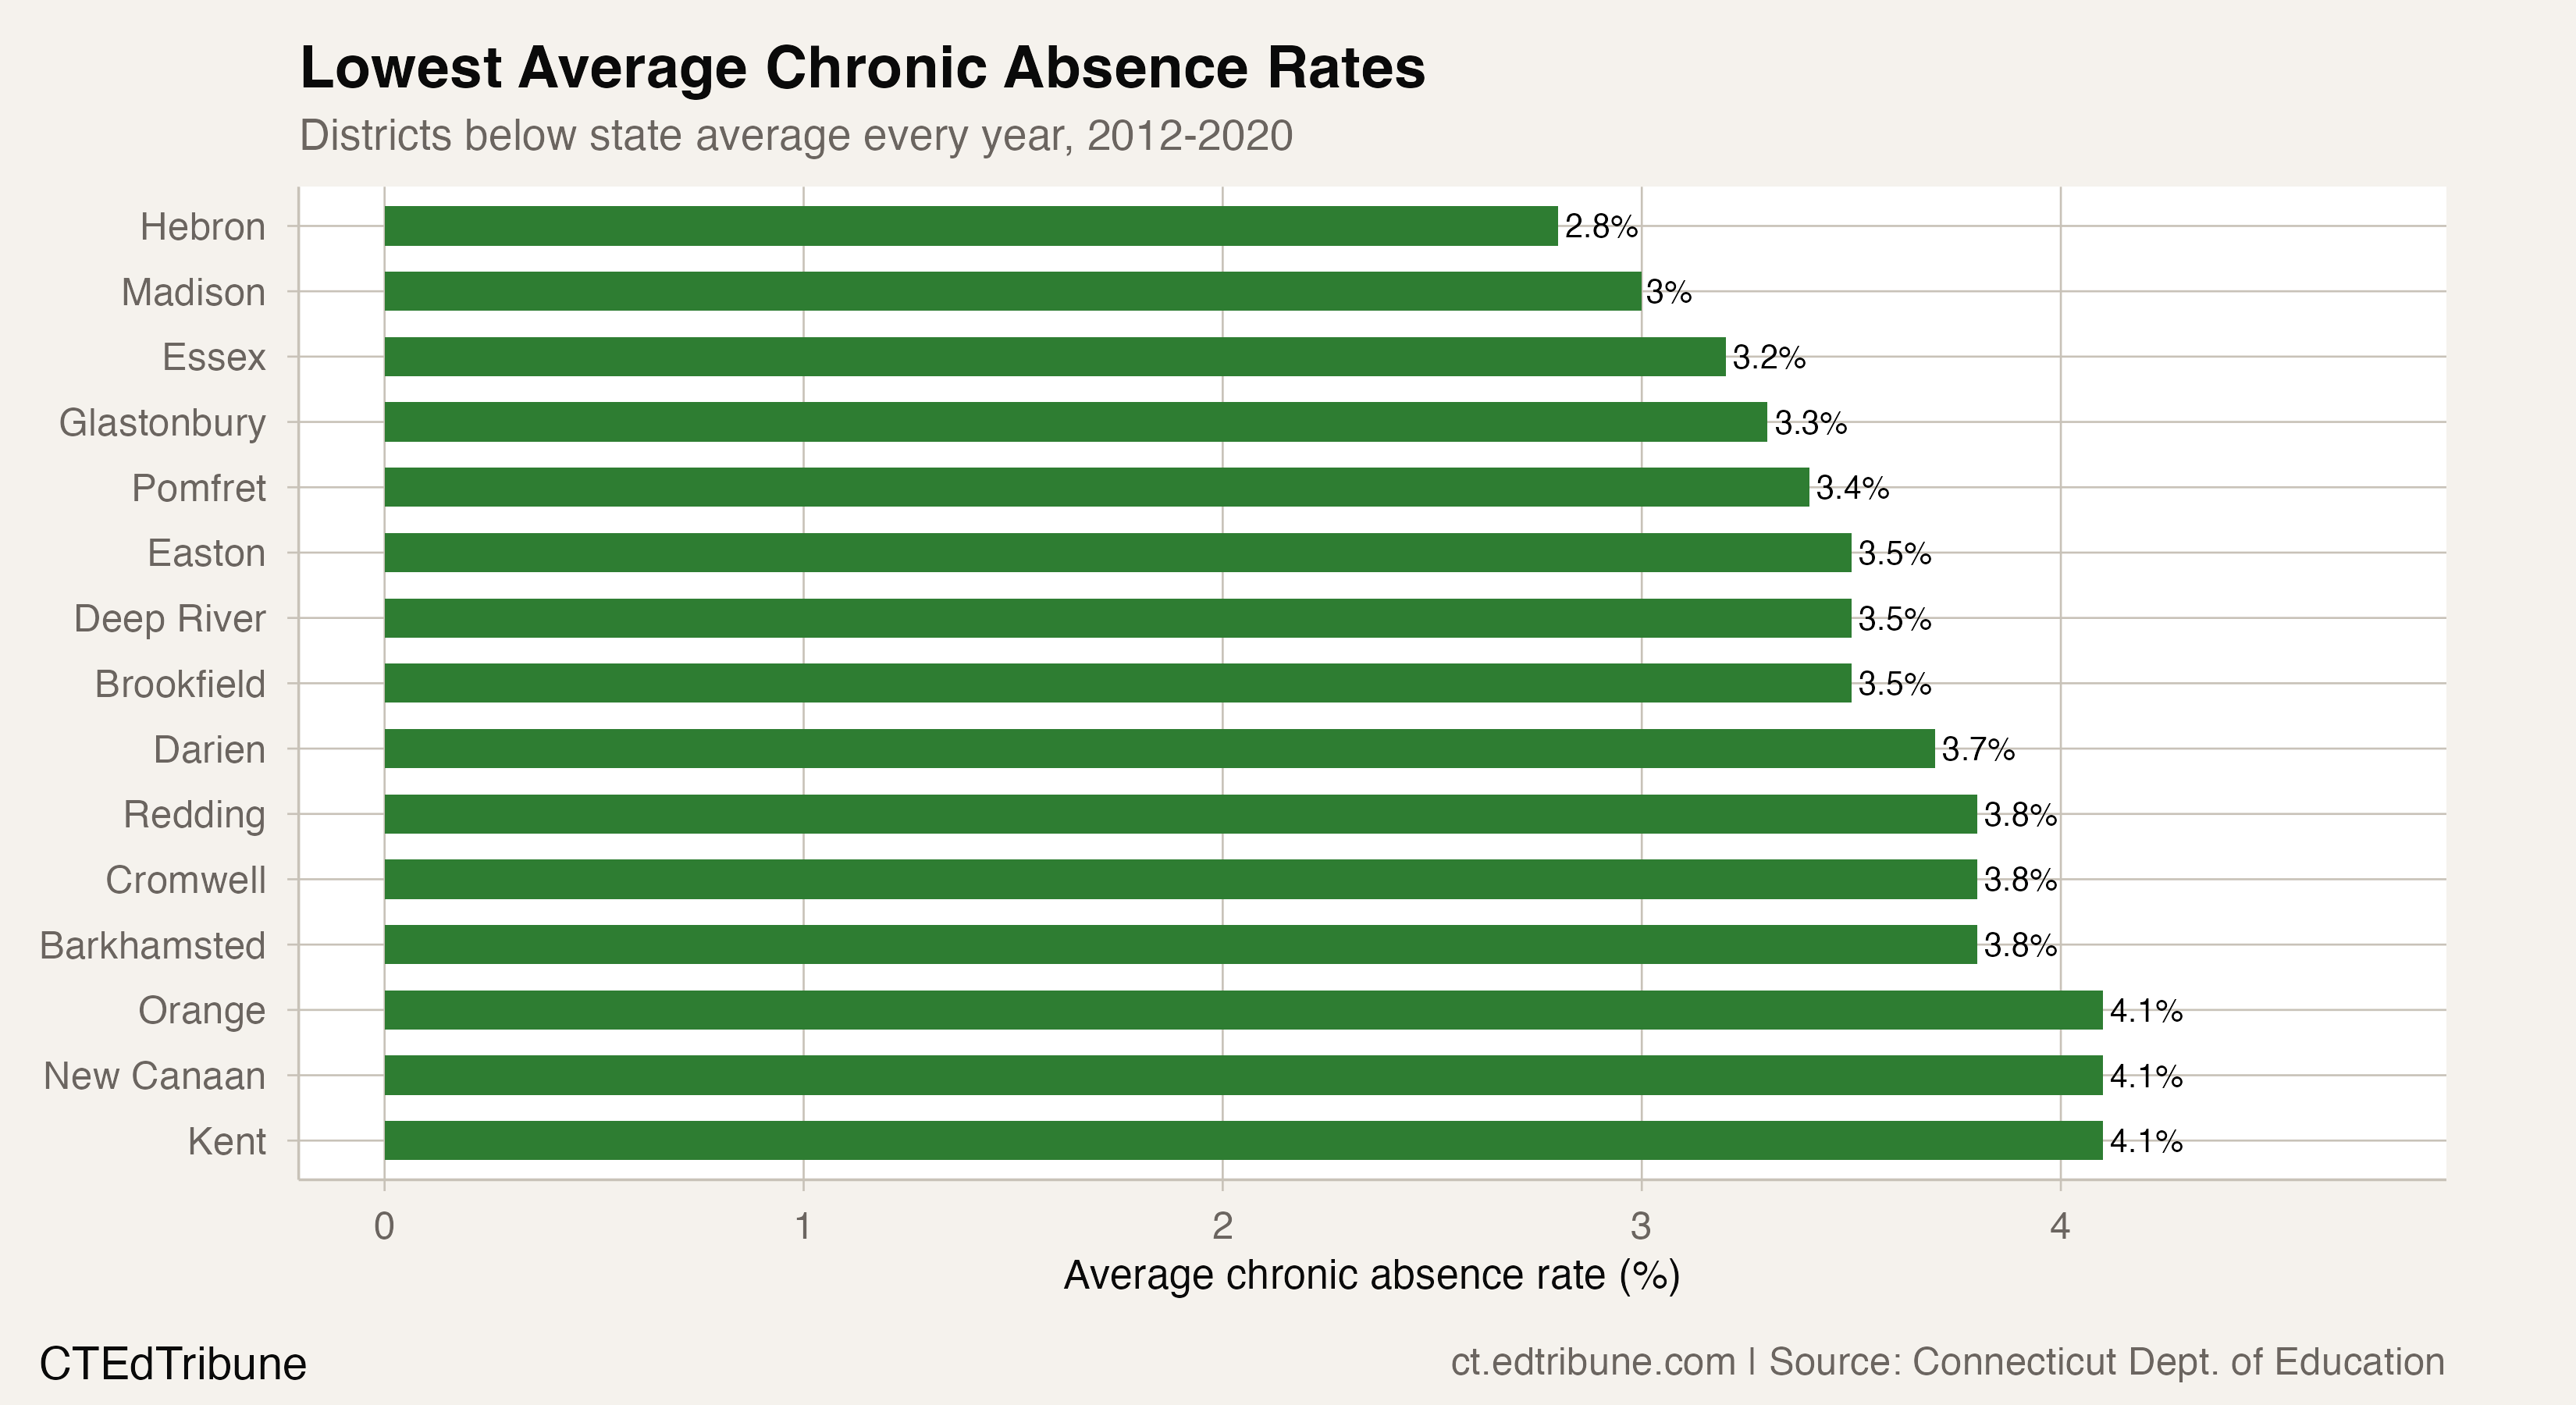
The best performers sustained remarkably low rates. Brookfield↗ET averaged 3.5% across nine years. Glastonbury↗ET averaged 3.3%. Hebron averaged 2.8%. Madison averaged 3.0%. These are not zero (even the healthiest communities have students who miss significant school time) but they represent a baseline where chronic absenteeism is a marginal phenomenon affecting fewer than 1 in 20 students.
Not just wealthy suburbs
The assumption that low chronic absenteeism is a proxy for wealth holds partially but not entirely. The list of 38 includes Darien, Greenwich↗ET, and New Canaan -- unmistakably affluent communities. But it also includes Cromwell↗ET, a middle-class town in Middlesex County. And Integrated Day Charter School District, the only charter school in the group.
Integrated Day Charter School in Norwich maintained a chronic absence rate below the state average for all nine years. As a school of choice serving a mixed-income population, its consistent presence on this list suggests that institutional practices -- not just demographics -- matter for attendance outcomes.
The divergence is widening
When plotted against the districts that were consistently above the state average -- 26 districts that exceeded the statewide figure every single year -- the gap is stark.
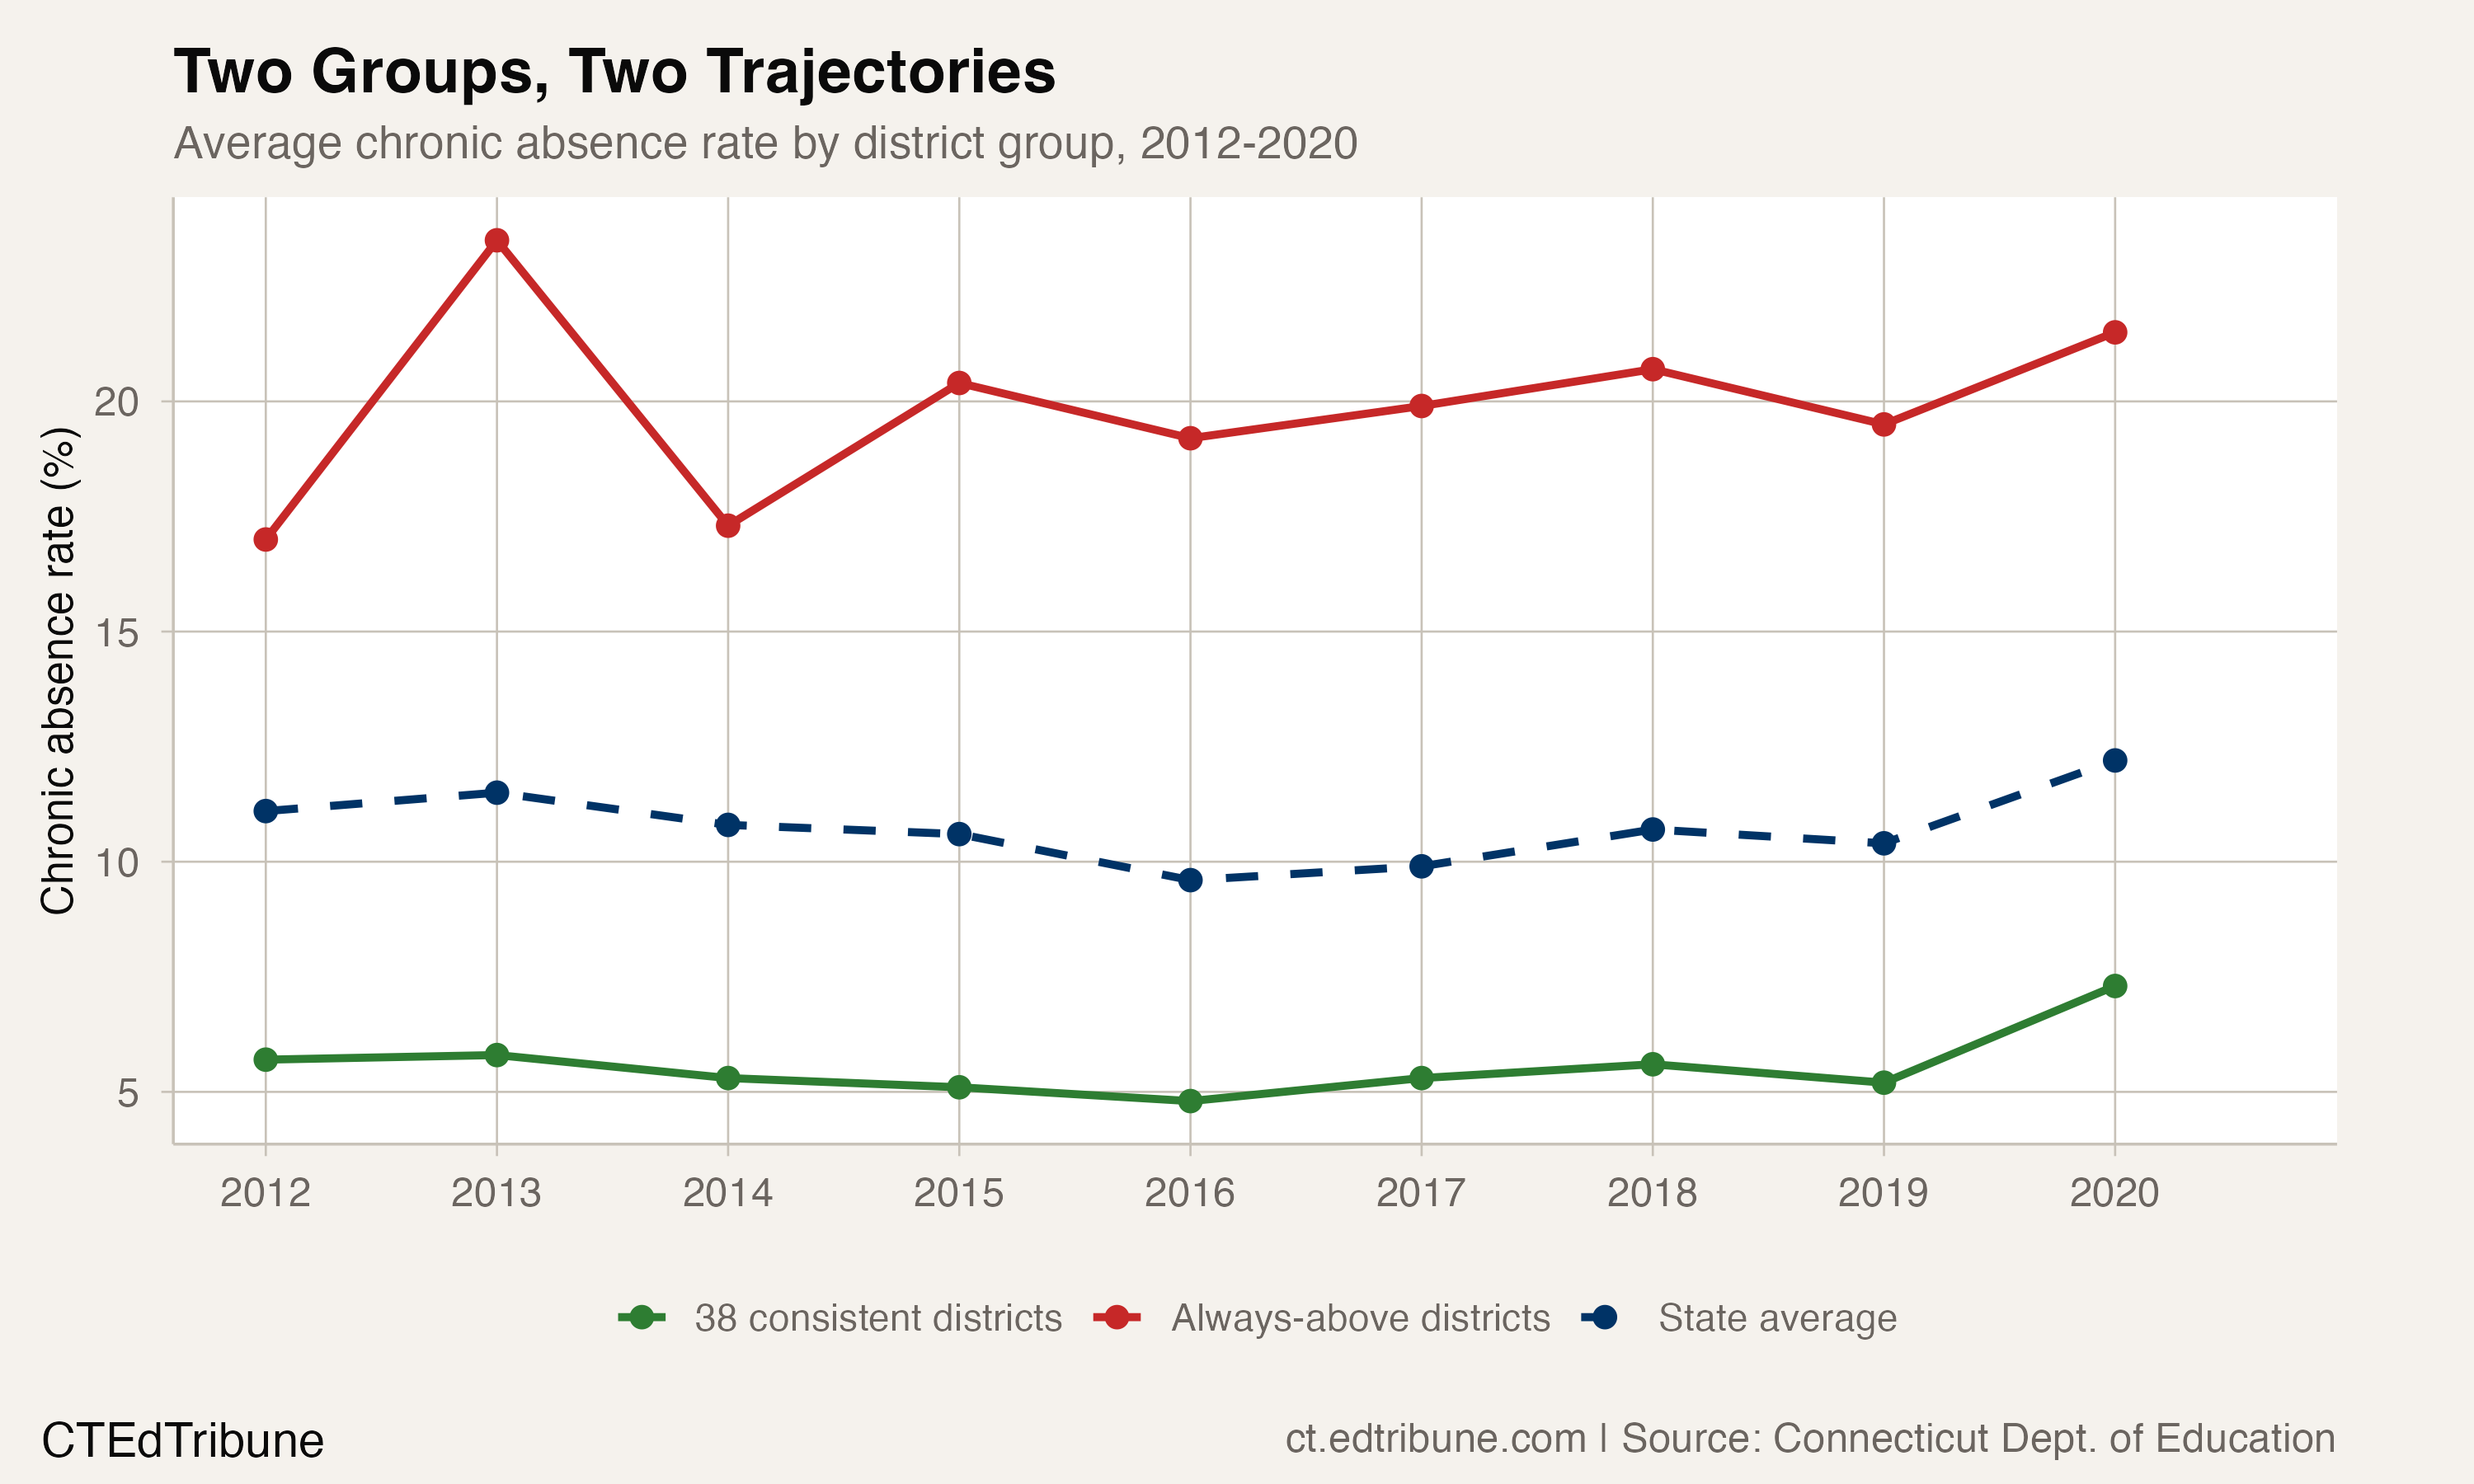
In 2012, the always-above group averaged roughly 19% and the always-below group averaged roughly 5%, a 14-point gap. By 2020, the always-above group had climbed to approximately 21% while the always-below group rose to about 7%, widening the gap to roughly 14 points. Both groups worsened, but the high-absence districts worsened from a much higher base, meaning the absolute number of students affected grew disproportionately.
The 26 always-above districts include Connecticut's largest urban centers: Hartford (25.1% average), New Haven (20.6%), Bridgeport (19.8%), Waterbury (18.2%), and New Britain (22.1%). Their chronic absence rates are not anomalies; they are structural features of the state's most disadvantaged communities.
Newtown↗ET: consistently low, but rising
Not all 38 districts are holding steady. Newtown↗ET School District -- site of the 2012 Sandy Hook Elementary School shooting -- stayed below the state average throughout the dataset, but its trajectory points the wrong direction: from 2.7% in 2015 to 5.7% in 2020. The district's average of 4.3% keeps it comfortably below the state figure, but the gradual worsening mirrors the suburban trend across Fairfield County.
A district can be "consistently below average" and still deteriorating. The state average is rising, and some districts in this group are rising with it -- just not fast enough to cross the line.
What separates the 38 from the 26
Connecticut's reduction guide identifies three tiers of intervention: universal prevention for all students, early intervention for students showing warning signs, and intensive support for chronically absent students. The districts that stay consistently below average tend to be places where the universal tier -- school climate, family engagement, accessible transportation -- works well enough that fewer students reach the warning-sign stage.
The ceiling and the floor
Connecticut's chronic absenteeism data reveals a state with two distinct attendance realities operating simultaneously. Thirty-eight districts have never exceeded the state average -- a sign that a significant share of the state's communities have functional attendance systems that keep chronic absence manageable. Twenty-six districts have never dropped below the state average -- entrenched, structural barriers that no single year of improvement has overcome.
The state's post-COVID recovery efforts (the LEAP program, $15 million in mental health specialist funding, CAT teams in urban districts) are targeted at the 26. But the pre-COVID data shows that the gap was not narrowing before the pandemic. It was either stable or widening, depending on the year.
The LEAP program and CAT teams are trying to do what pre-COVID policy never managed: move districts from the always-above group into the middle. The pre-COVID data is not encouraging on that front. Nine years of data, and not one of the 26 ever dipped below the state average. Not once.
Detailed code that reproduces the analysis and figures in this article is available exclusively to EdTribune subscribers.
Discussion
Sign in to join the discussion.
Loading comments...