Correction (July 21, 2026): An earlier version said Waterbury's high-needs advantage widened every year after 2022. It widened to 5.9 points in 2024, then narrowed to 5.1 points in 2025. The article also now labels the statewide comparator correctly as the all-student rate, which includes high-needs students. A later audit corrected “doubled” to “nearly doubled” for the change from 24 to 47 districts and removed unsupported interpretations about subgroup composition, district gap mechanisms and future rates.
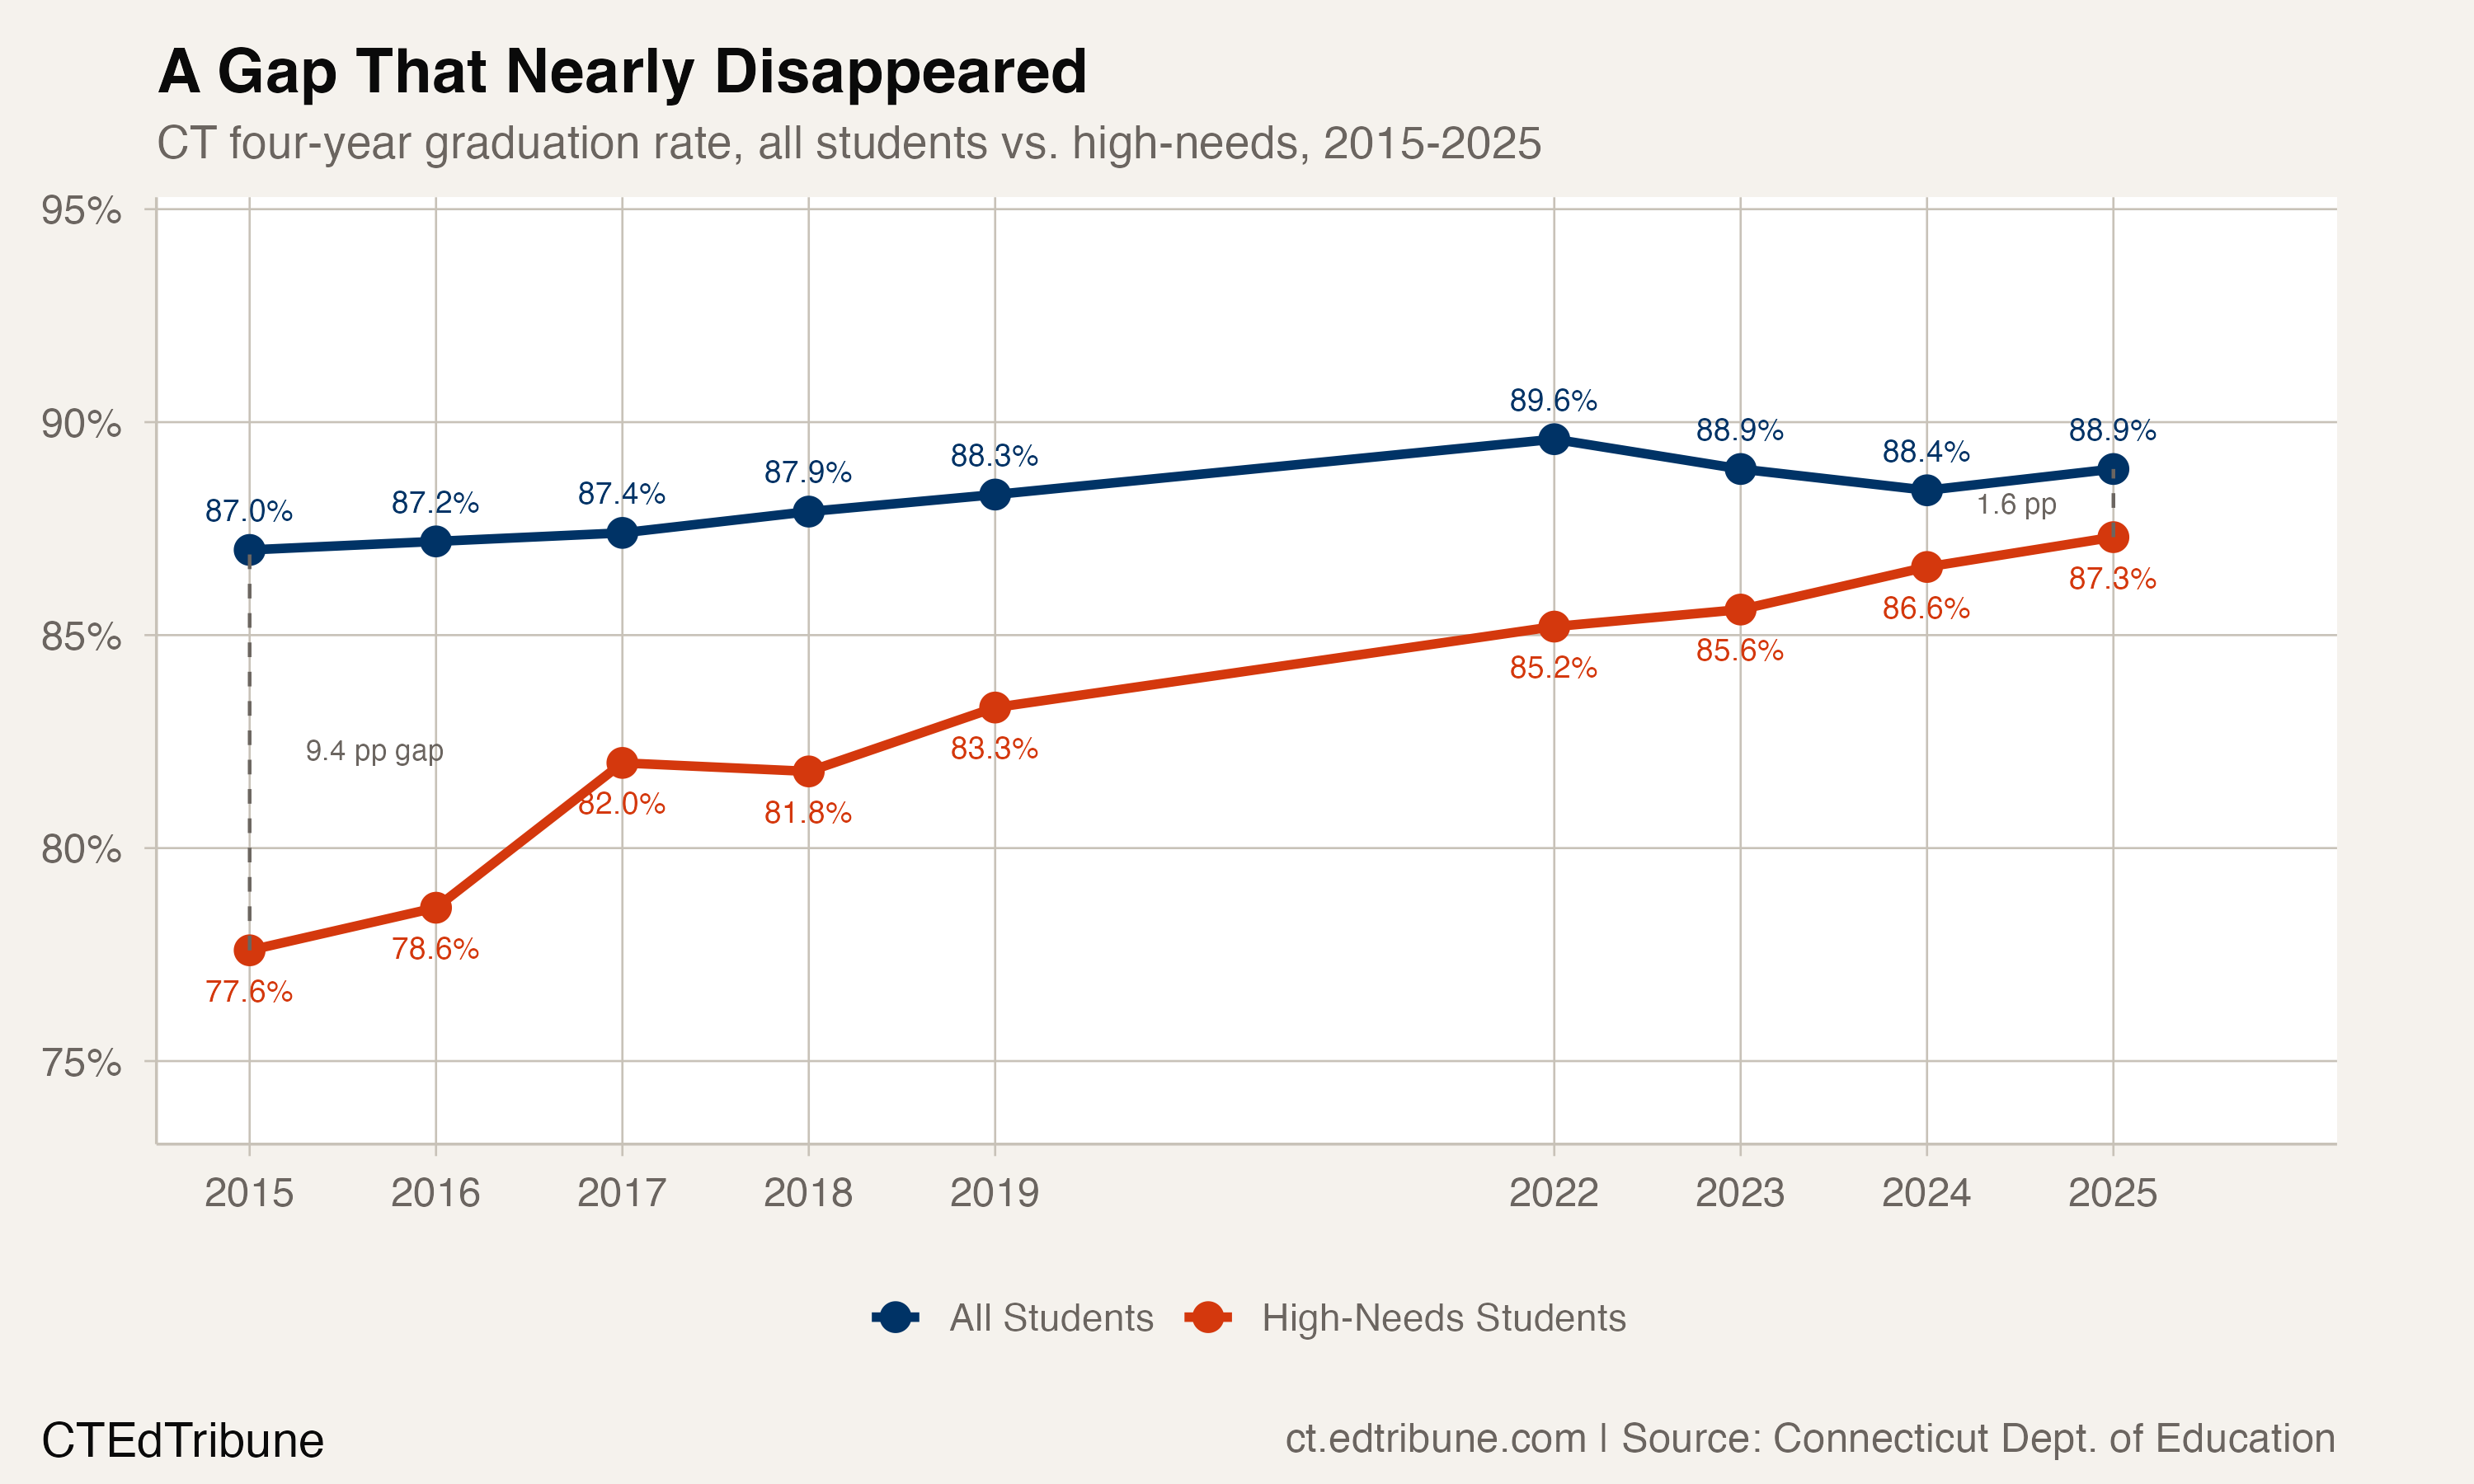
In 2015, Connecticut's reported four-year graduation rate for high-needs students was 9.4 percentage points below the all-student rate. In 2025, the difference is 1.6 points.
That is not a rounding error. The four-year graduation rate for high-needs students, a group that includes anyone eligible for free or reduced-price meals, receiving special education services, or classified as an English learner, was 77.6% in 2015.
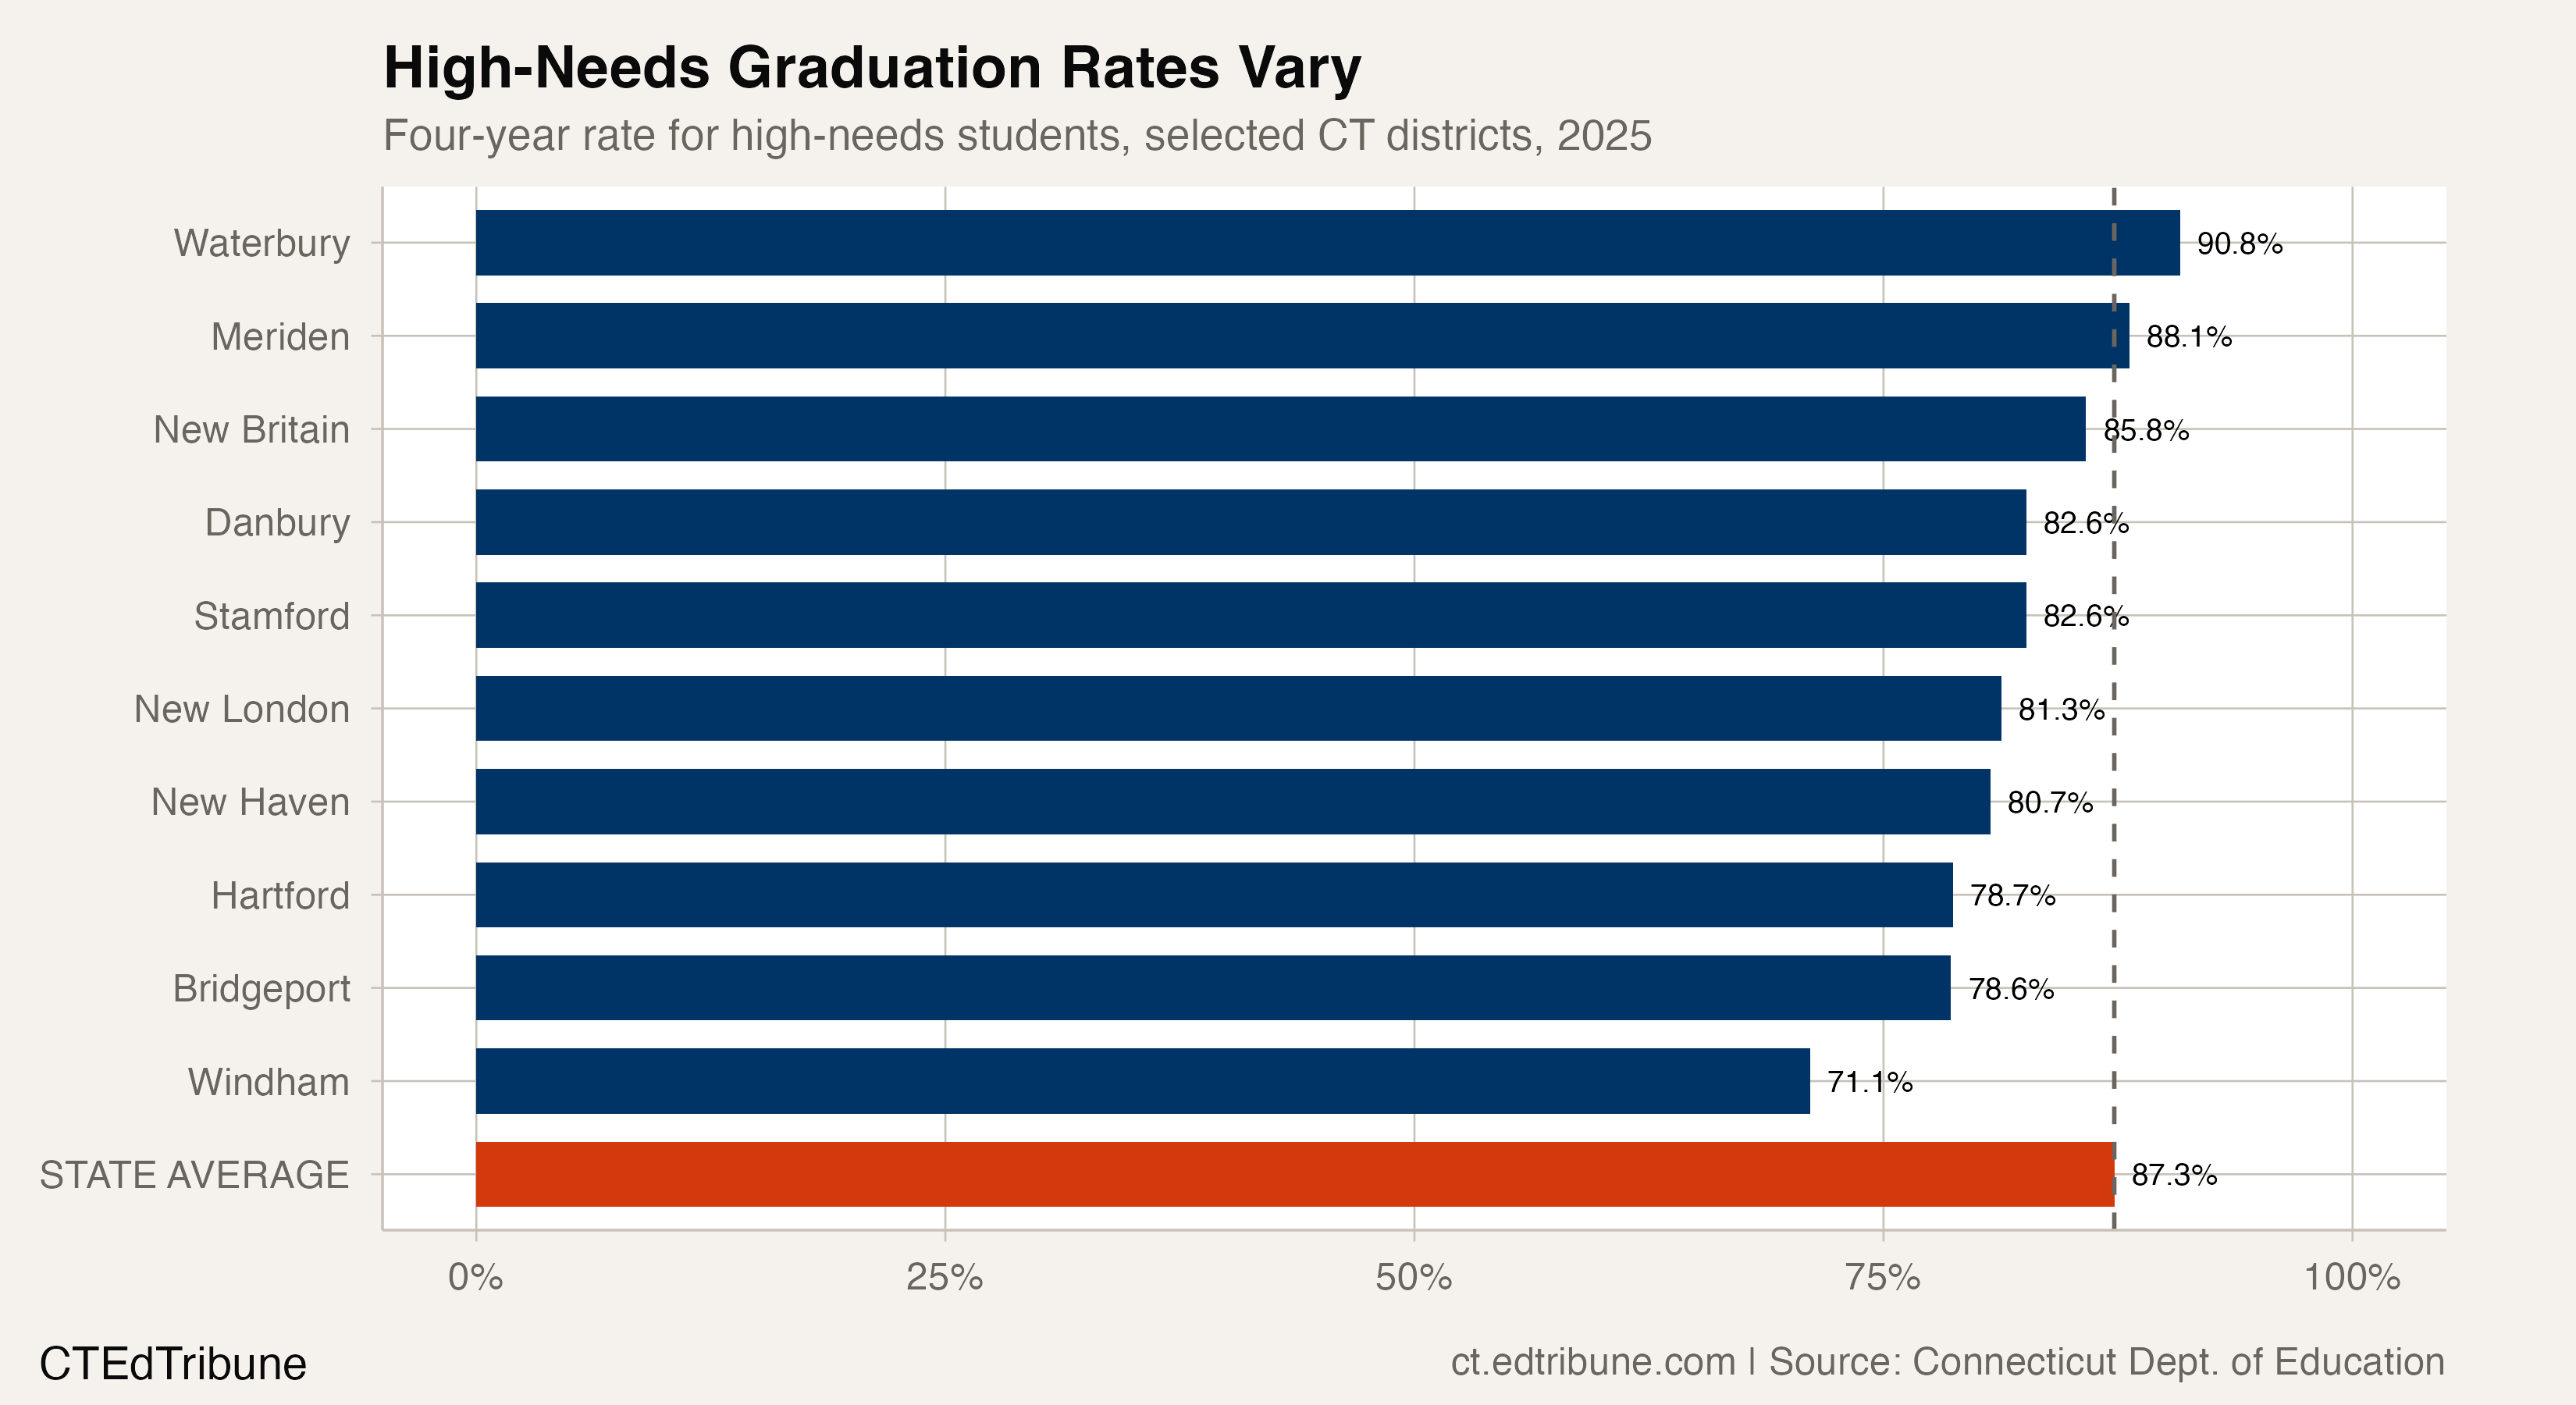
The 2025 statewide high-needs four-year rate was 87.3%.
The all-student rate was 87.0% in 2015 and reached 88.9% in 2025. High-needs students gained 9.7 points. The all-student rate gained 1.9. The high-needs gain was 5.1 times as large.
The Convergence, Year by Year
The narrowing was not gradual. It came in two bursts. The first arrived between 2016 and 2017, when the high-needs rate jumped 3.4 points in a single year (78.6% to 82.0%) while the all-student rate barely moved. The second wave began after the pandemic: between 2022 and 2025, high-needs students gained another 2.1 points while the overall rate stayed flat, hovering between 88.4% and 89.6%.
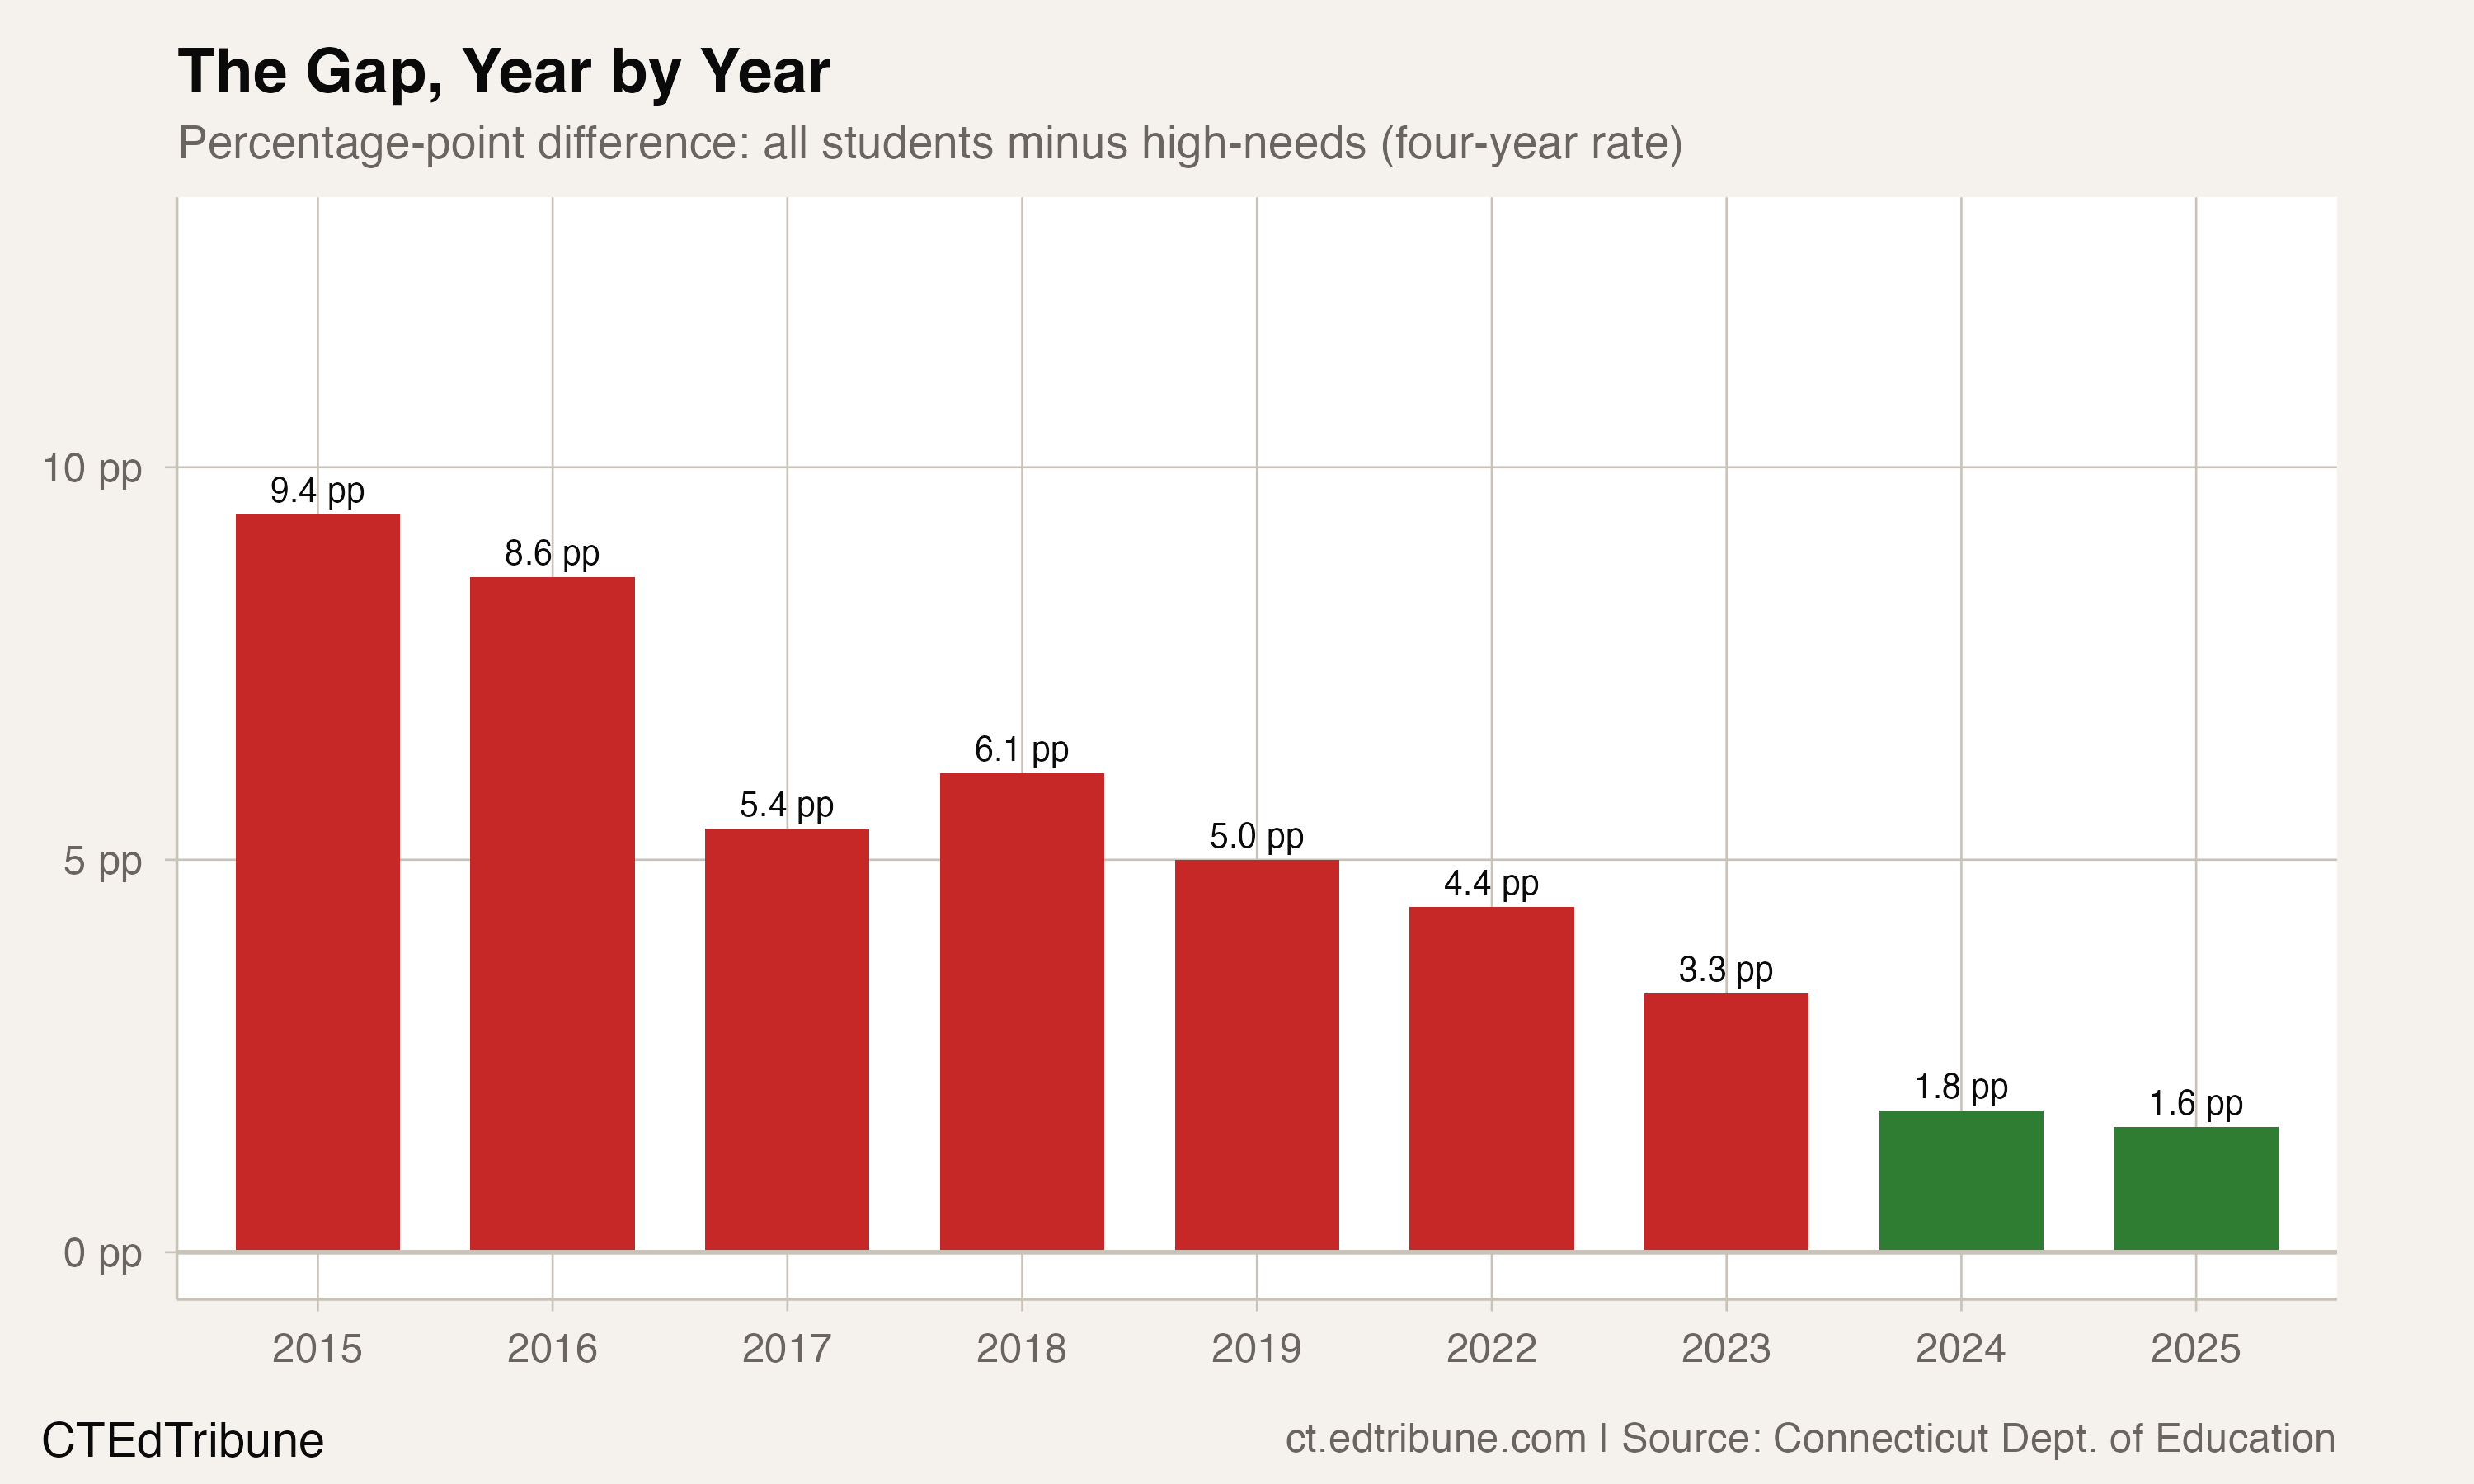
The 2022 reading is notable. That year, the all-student rate hit its decade high of 89.6%, while the high-needs rate reached 85.2%. The gap was 4.4 points. Since then, the all-student rate drifted back to 88.9%, but high-needs students kept climbing, pushing the gap below 2 points for the first time.
Where the Gap Already Flipped
The statewide number masks something more striking at the district level. In more than a third of Connecticut's districts, high-needs students now graduate at a higher rate than the student body overall.
In 2015, 24 out of 125 districts with data showed a negative gap, meaning high-needs students outperformed. By 2025, that number nearly doubled to 47 out of 133. Twenty-eight districts that had a positive gap in 2015 flipped to negative by 2025.
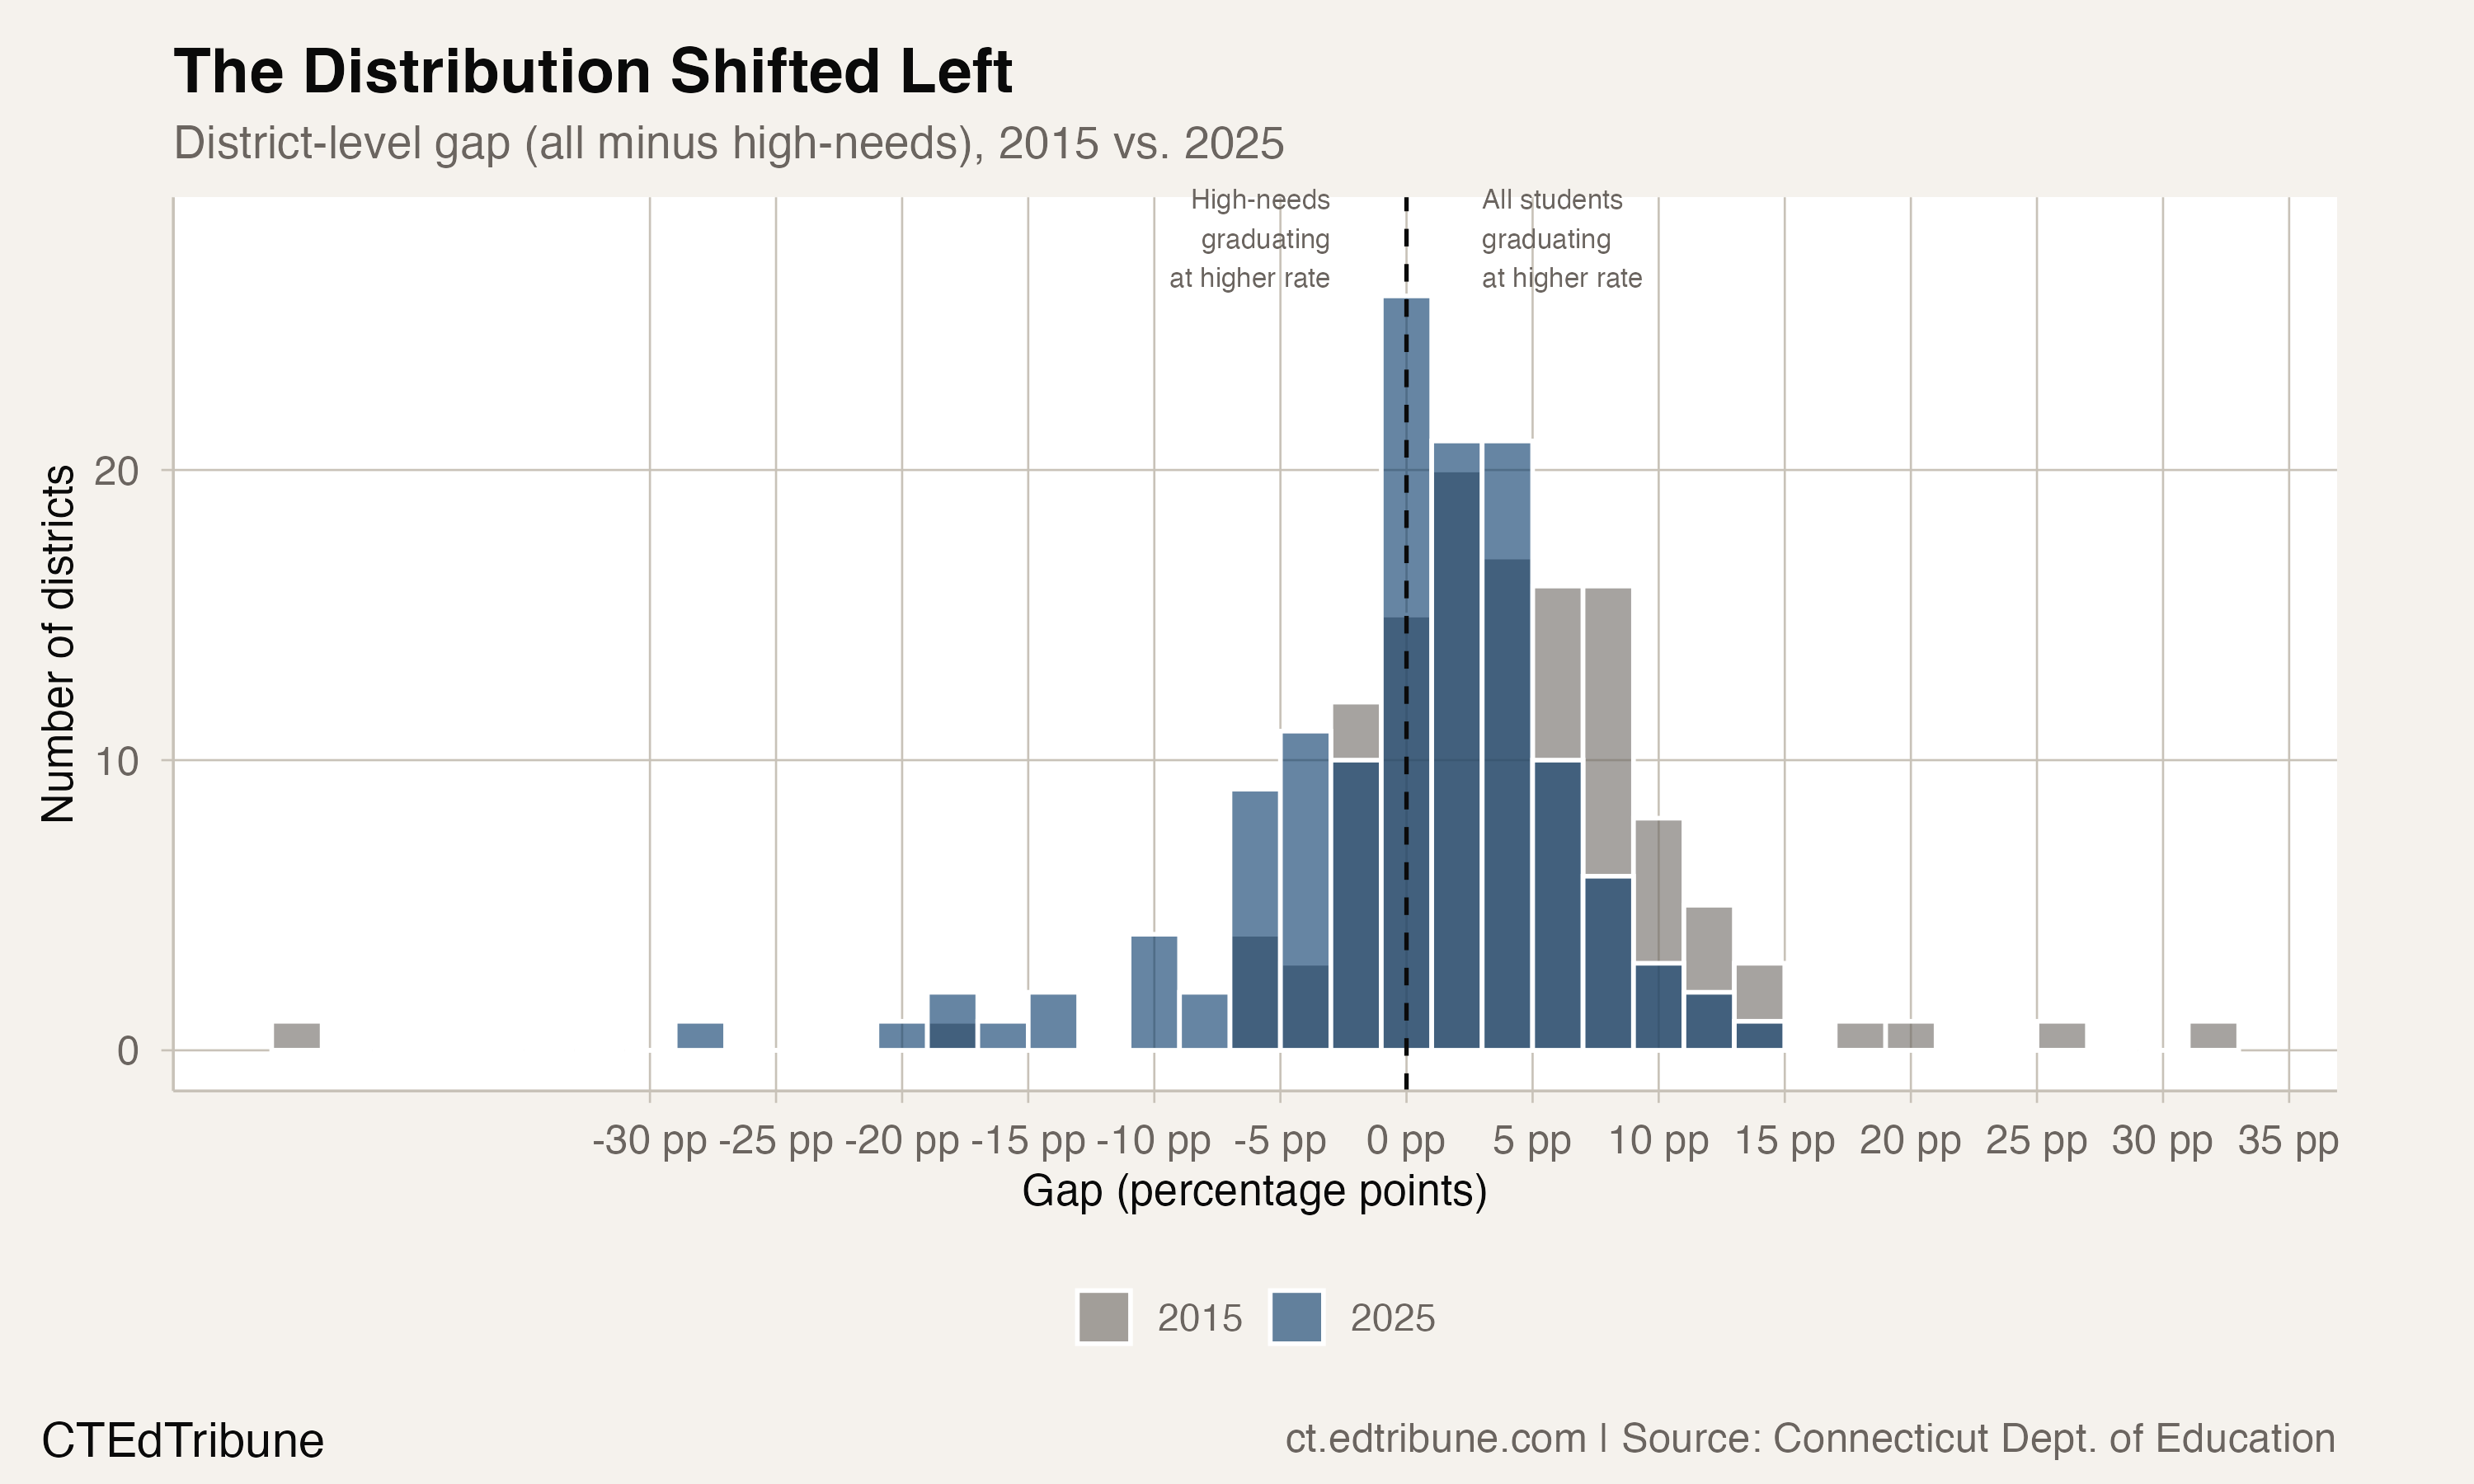
Some of the flips are large. In New Britain↗ET, the 2015 gap was effectively zero (63.6% all, 63.5% high-needs). By 2025, high-needs students graduated at 85.8% while the all-student rate sat at 71.0%, a 14.8-point advantage for high-needs students. In Waterbury↗ET, the gap went from 1.9 points favoring all students to 5.1 points favoring high-needs.
The Waterbury Trajectory
Waterbury↗ET deserves a closer look. Its high-needs graduation rate in 2015 was 65.9%. By 2025, it was 90.8%, a gain of 24.9 percentage points across a decade that included a pandemic.
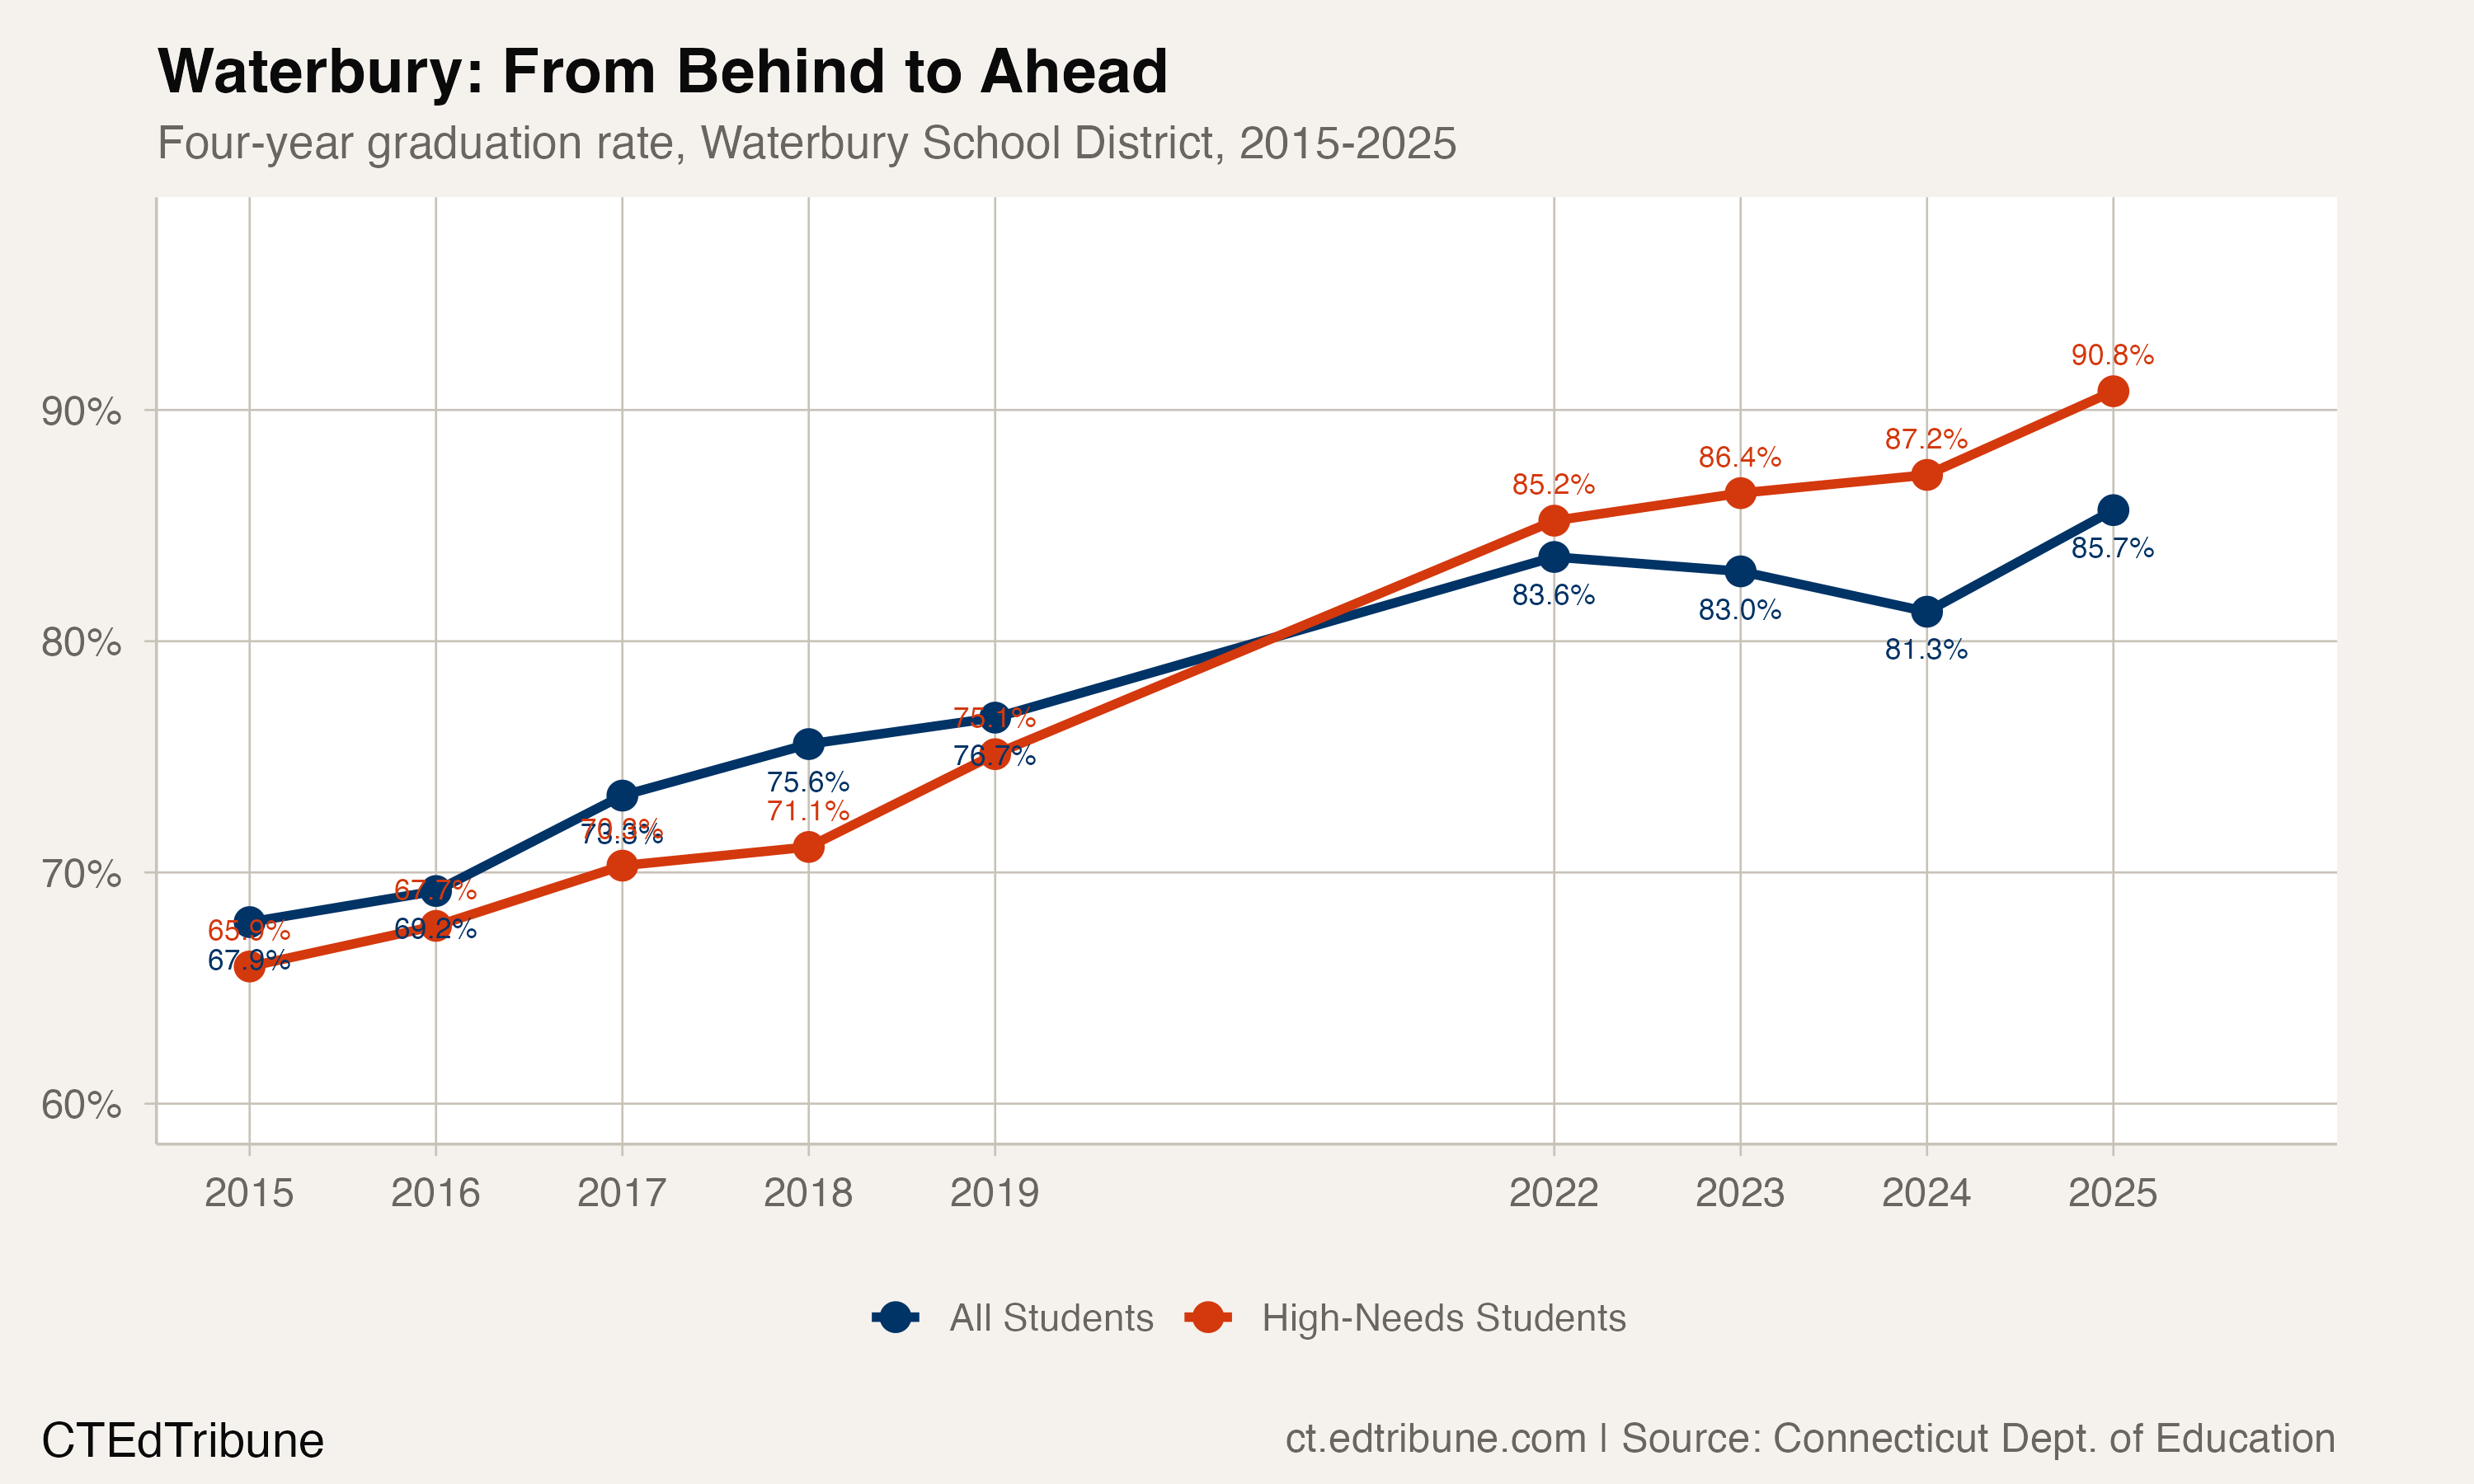
The all-student rate also improved substantially, from 67.9% to 85.7%, but the high-needs rate outpaced it by about 7 points. Starting in 2022, the lines crossed: high-needs students graduated at higher rates than the district average in every available year thereafter. The advantage reached 5.9 points in 2024, then narrowed to 5.1 points in 2025.
Waterbury is one of Connecticut's 33 Alliance Districts, a designation created in 2012 for districts with among the state's lowest Accountability Index measures. Alliance Districts receive increased Education Cost Sharing funding tied to district improvement plans. All five of Waterbury's high schools showed graduation rate improvements between the 2018 and 2019 cohorts, according to a district announcement reported by Patch.
"Sustained improvements are the collective work of many joining in to assure students' needs are met." -- Waterbury Superintendent Verna D. Ruffin, Naugatuck Patch
A Definitional Question Worth Asking
Connecticut's "high needs" category is broad. It includes any student who is eligible for free or reduced-price meals, receives special education, or is classified as an English learner. These groups overlap substantially: a student who qualifies for free lunch and has an IEP is counted once, not twice, but the category captures a large share of total enrollment.
That breadth matters for interpreting the gap. The 1.6-point gap does not measure outcomes for any one component subgroup. It compares the broad composite group labeled "high needs" with the all-student rate, which includes that group.
The more revealing comparison may be the six-year rate, where Connecticut does report non-high-needs students separately. In 2025, the six-year rate was 98.7% for non-high-needs students and 87.3% for high-needs, an 11.4-point gap. The four-year gap compresses the picture because it compares high-needs students to an "all" category that includes them.
The Paradox in New Haven
Not every district's story is straightforward. In New Haven↗ET, the high-needs graduation rate rose from 75.8% in 2015 to 80.7% in 2025, a 4.9-point gain. But the all-student rate fell, from 75.5% to 72.5%. The gap is negative by 8.2 points, not because high-needs students surged but because the overall rate declined while high-needs students held relatively steady.
Both movements contributed to New Haven's negative gap: the high-needs rate rose 4.9 points while the all-student rate fell 3.0 points.
What Is Driving the Gains
Suggestive context: the CSDE's 2024-25 accountability results highlighted 140 Schools of Distinction, including 34 in Alliance Districts, and described dual credit, attendance and rigorous-coursework strategies. The graduation files do not test whether those strategies caused the high-needs rate gain.
A competing explanation is compositional: changes in who is classified as high-needs could change the rate without an equivalent change in school effectiveness. The analysis does not measure classification changes, so it cannot apportion the 9.7-point statewide gain between student composition and school supports.
What Comes Next
The remaining question is whether the gains hold at the district level. Hartford↗ET and Bridgeport↗ET, two of the state's largest Alliance Districts, still have high-needs rates below 80%, well short of the 87.3% state average.
The 2024-25 accountability results also flagged a persistent gap in on-track measures: the share of high-needs students on track to graduate was 75.9%, still more than 19 percentage points below non-high-needs peers. Graduation rates measure an endpoint; on-track rates measure an earlier stage of the path to graduation.
Detailed code that reproduces the analysis and figures in this article is available exclusively to EdTribune subscribers.
Discussion
Sign in to join the discussion.
Loading comments...