Correction (July 21, 2026): The original article said Hartford's 4.6-point increase from 2023 to 2024 was the largest in the district dataset. It ranked 12th among 137 matched district changes. A chart also labeled changes between available observations as year-over-year even though its 2022 bar spans the unavailable 2020 and 2021 cohorts. This version corrects those claims and removes interpretations about literacy, grading policy, demographics and fiscal oversight that the aggregate graduation file cannot test.
Hartford School District↗ET's four-year adjusted cohort graduation rate reached 78.6% in 2025, the highest result in the nine available years analyzed from 2015 through 2025.
Connecticut's statewide rate was 88.9%, leaving Hartford 10.3 percentage points lower. The gap was narrower than in 2018, when Hartford's 68.8% rate was 19.1 points below the state.
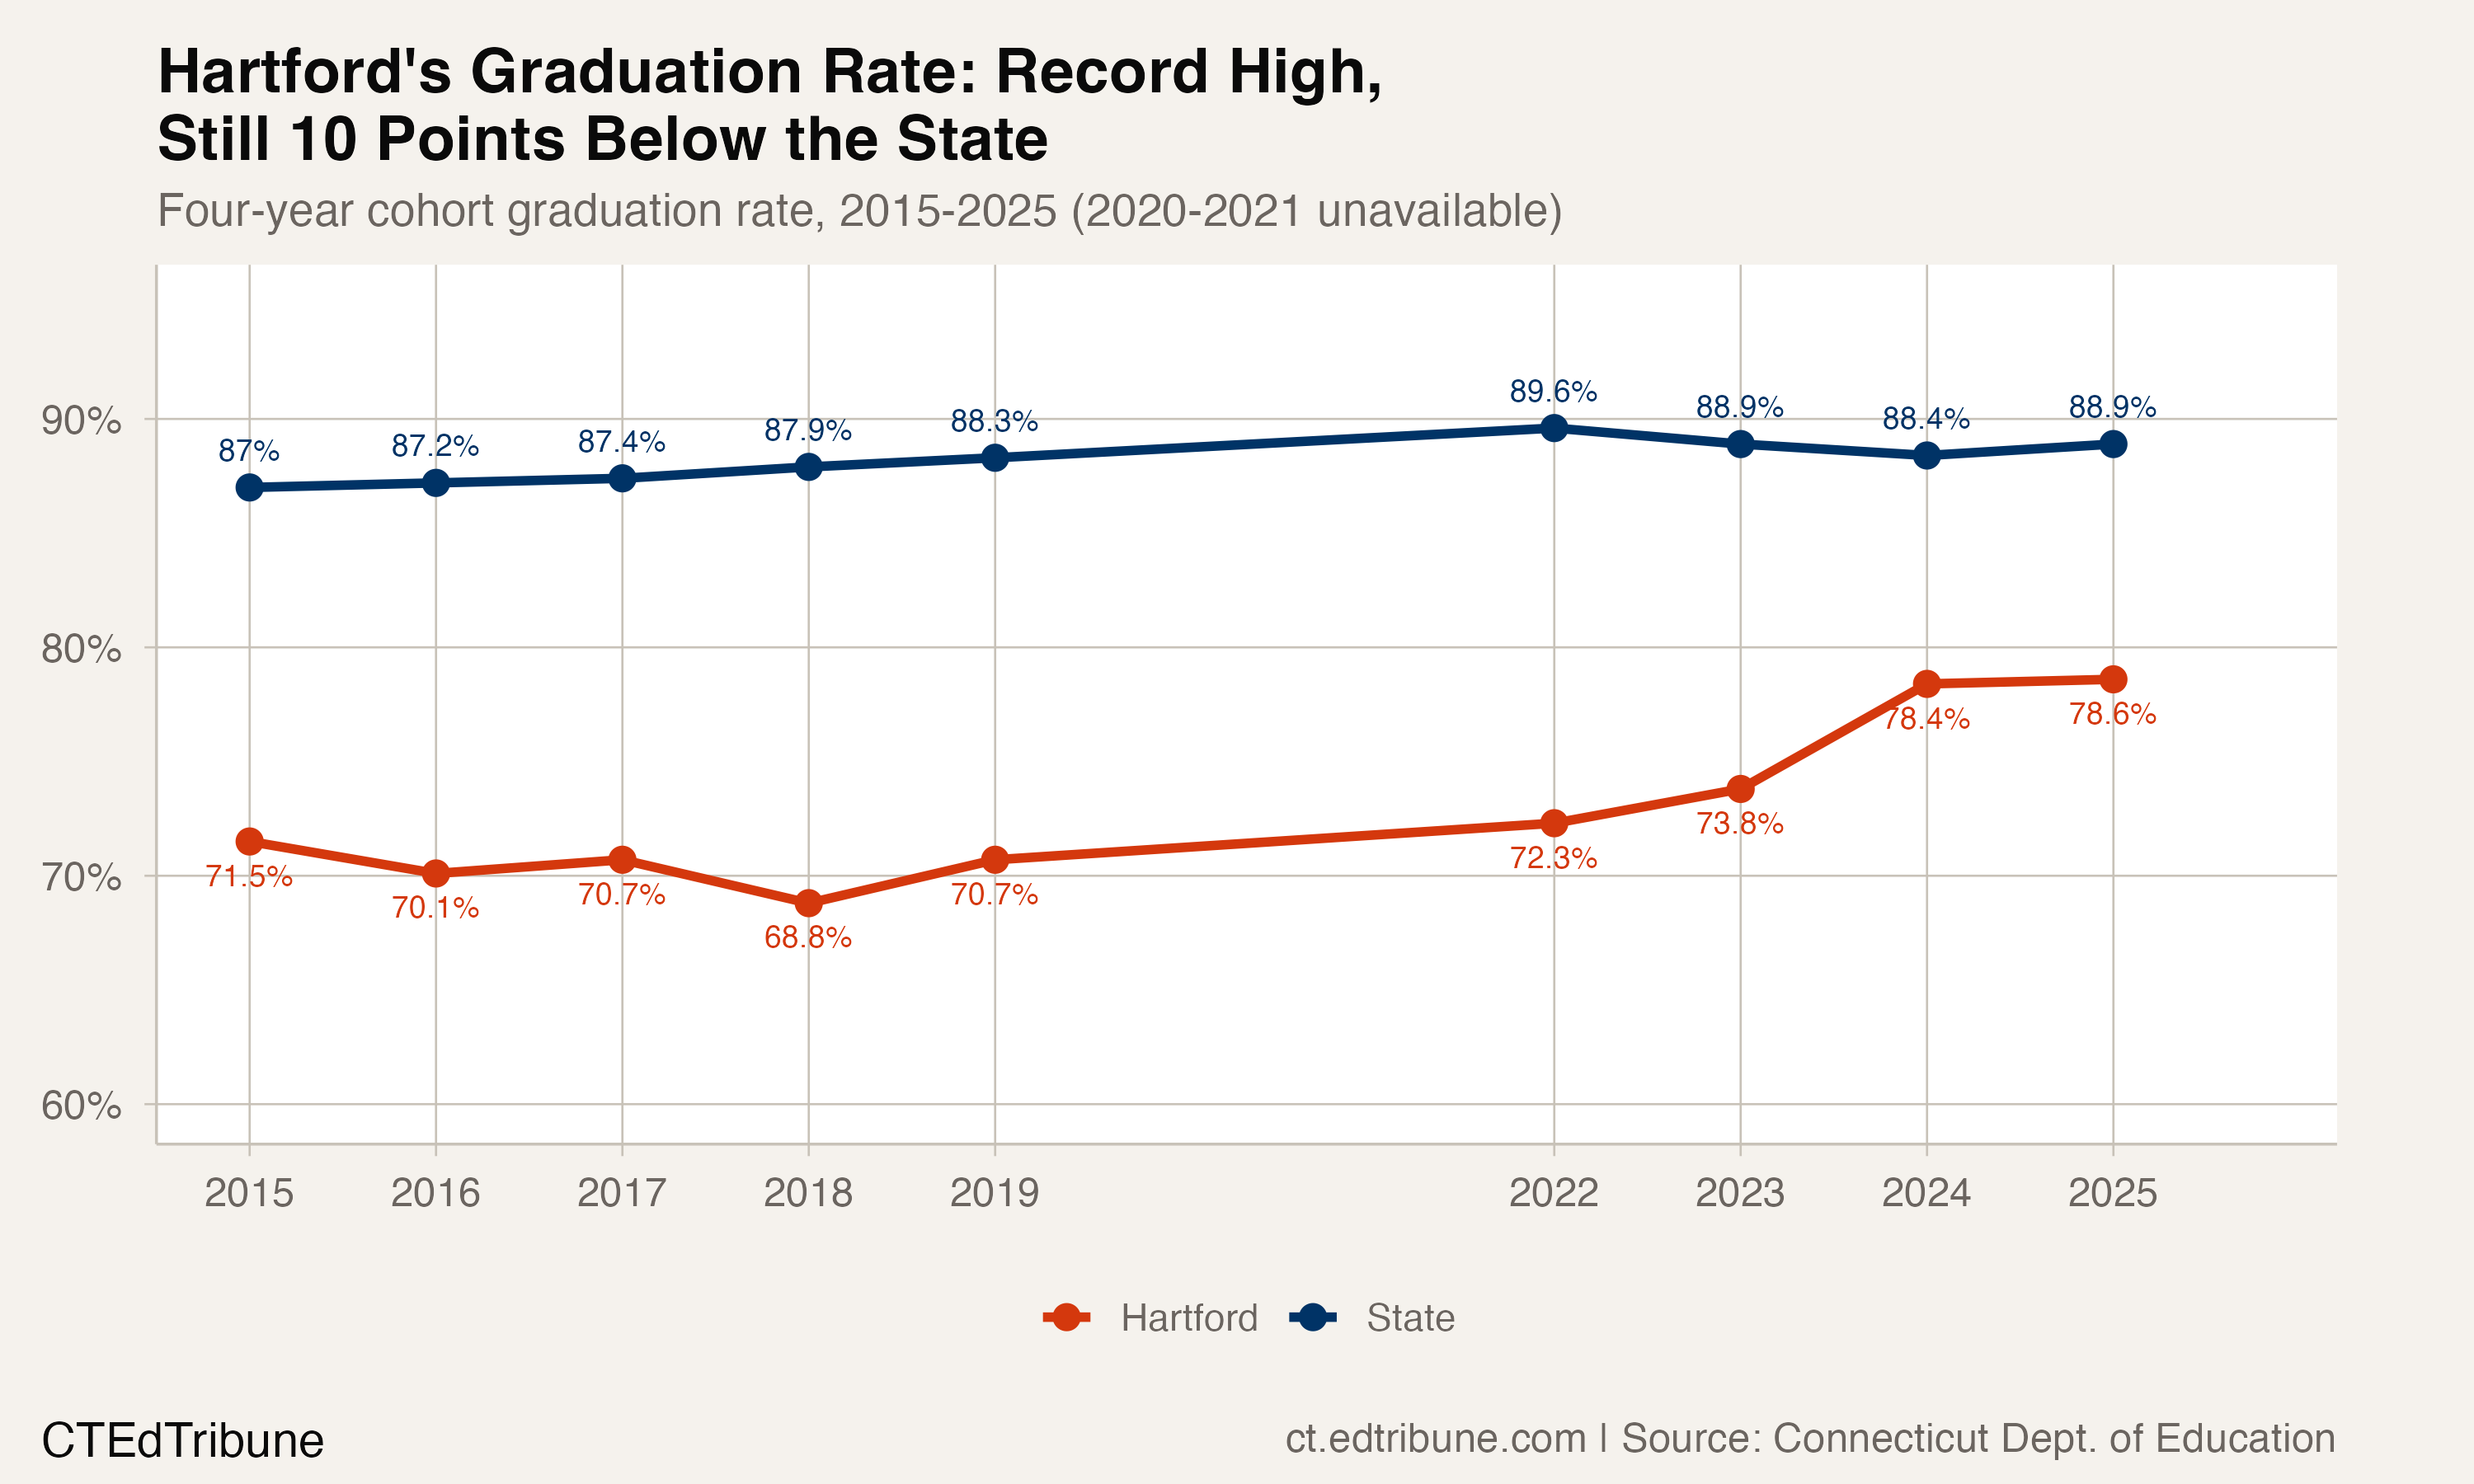
The Increase Followed an Earlier Flat Period
Hartford's rate ranged from 68.8% to 71.5% between 2015 and 2019. It ended that period at 70.7%, 0.8 point below its 2015 rate.
The next available result was 72.3% in 2022. Hartford rose to 73.8% in 2023, 78.4% in 2024 and 78.6% in 2025.
The 2023-to-2024 increase was 4.6 points. It was material, but it was not the largest district increase that year: Hartford ranked 12th among 137 districts with rates in both years.
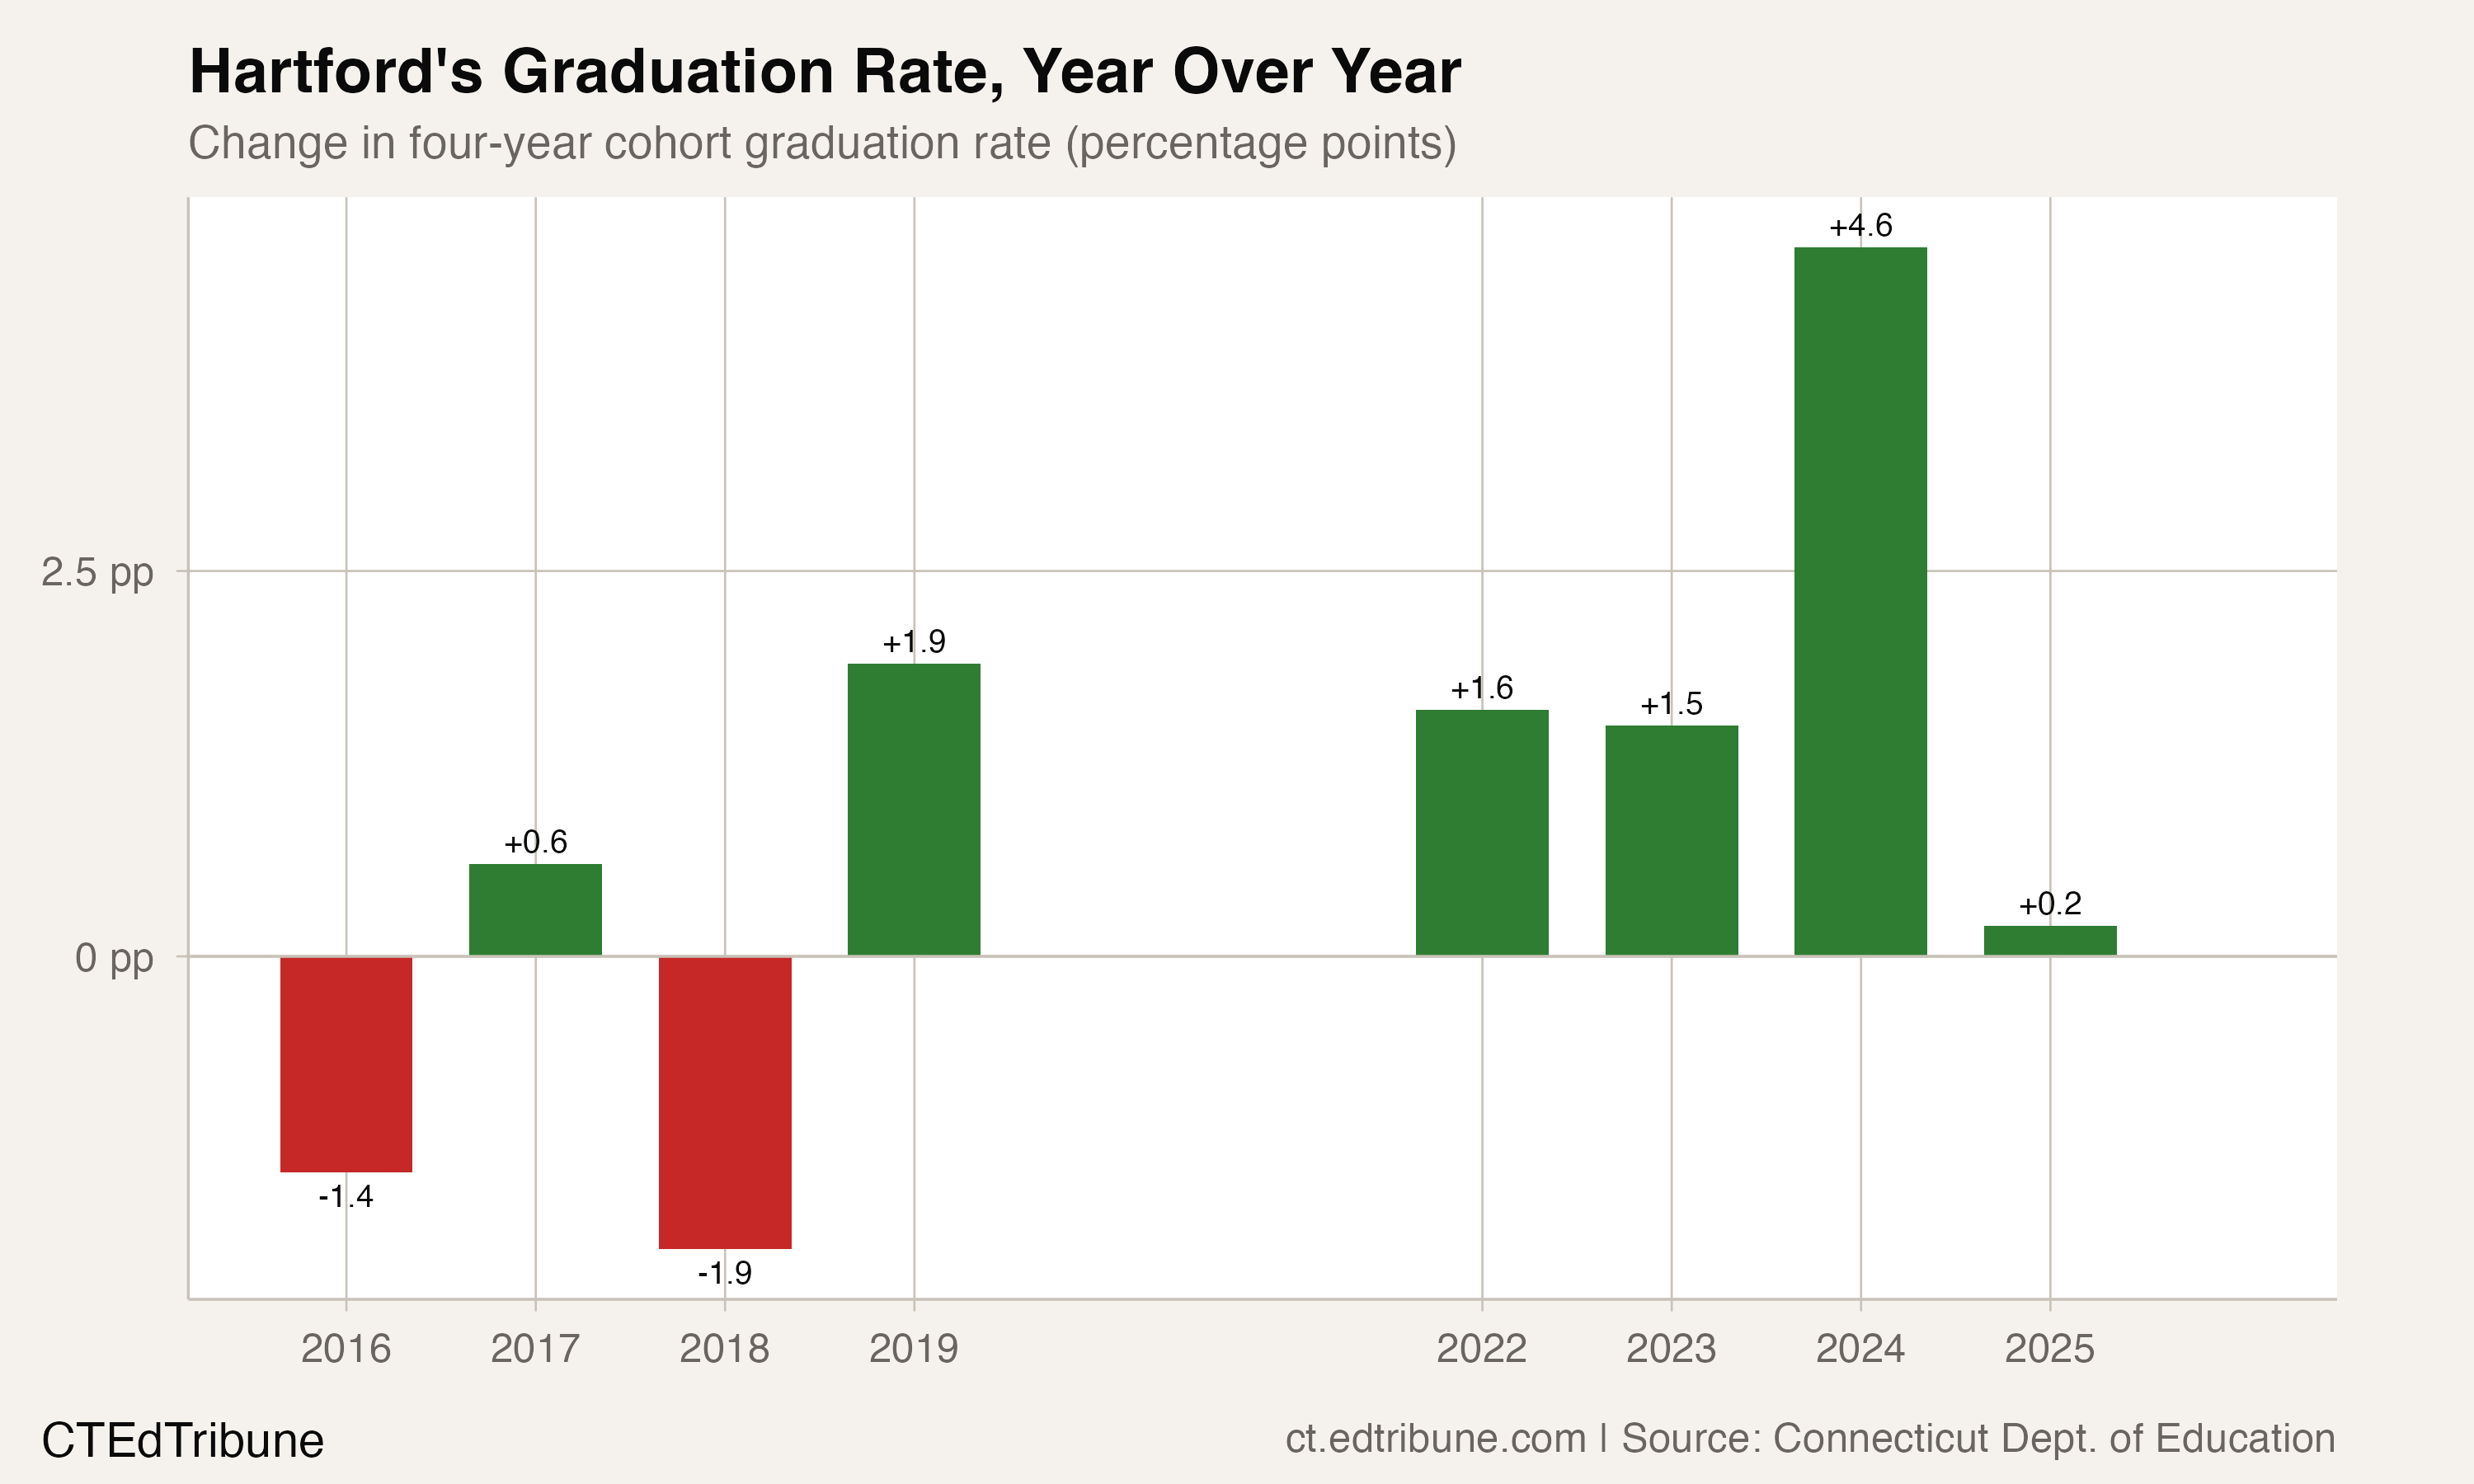
The chart treats each bar as a change between available observations. The 2022 bar covers the interval from the 2019 result because the package's district series does not include 2020 or 2021.
Hartford Moved Up From Its Earlier Position
In 2019, only four reported district rates were below Hartford's. In 2022, only one was lower.
By 2025, Hartford ranked 123rd of 135 reported district rates, equivalent to the 13th-lowest position. Fifteen district rates were below 80%.
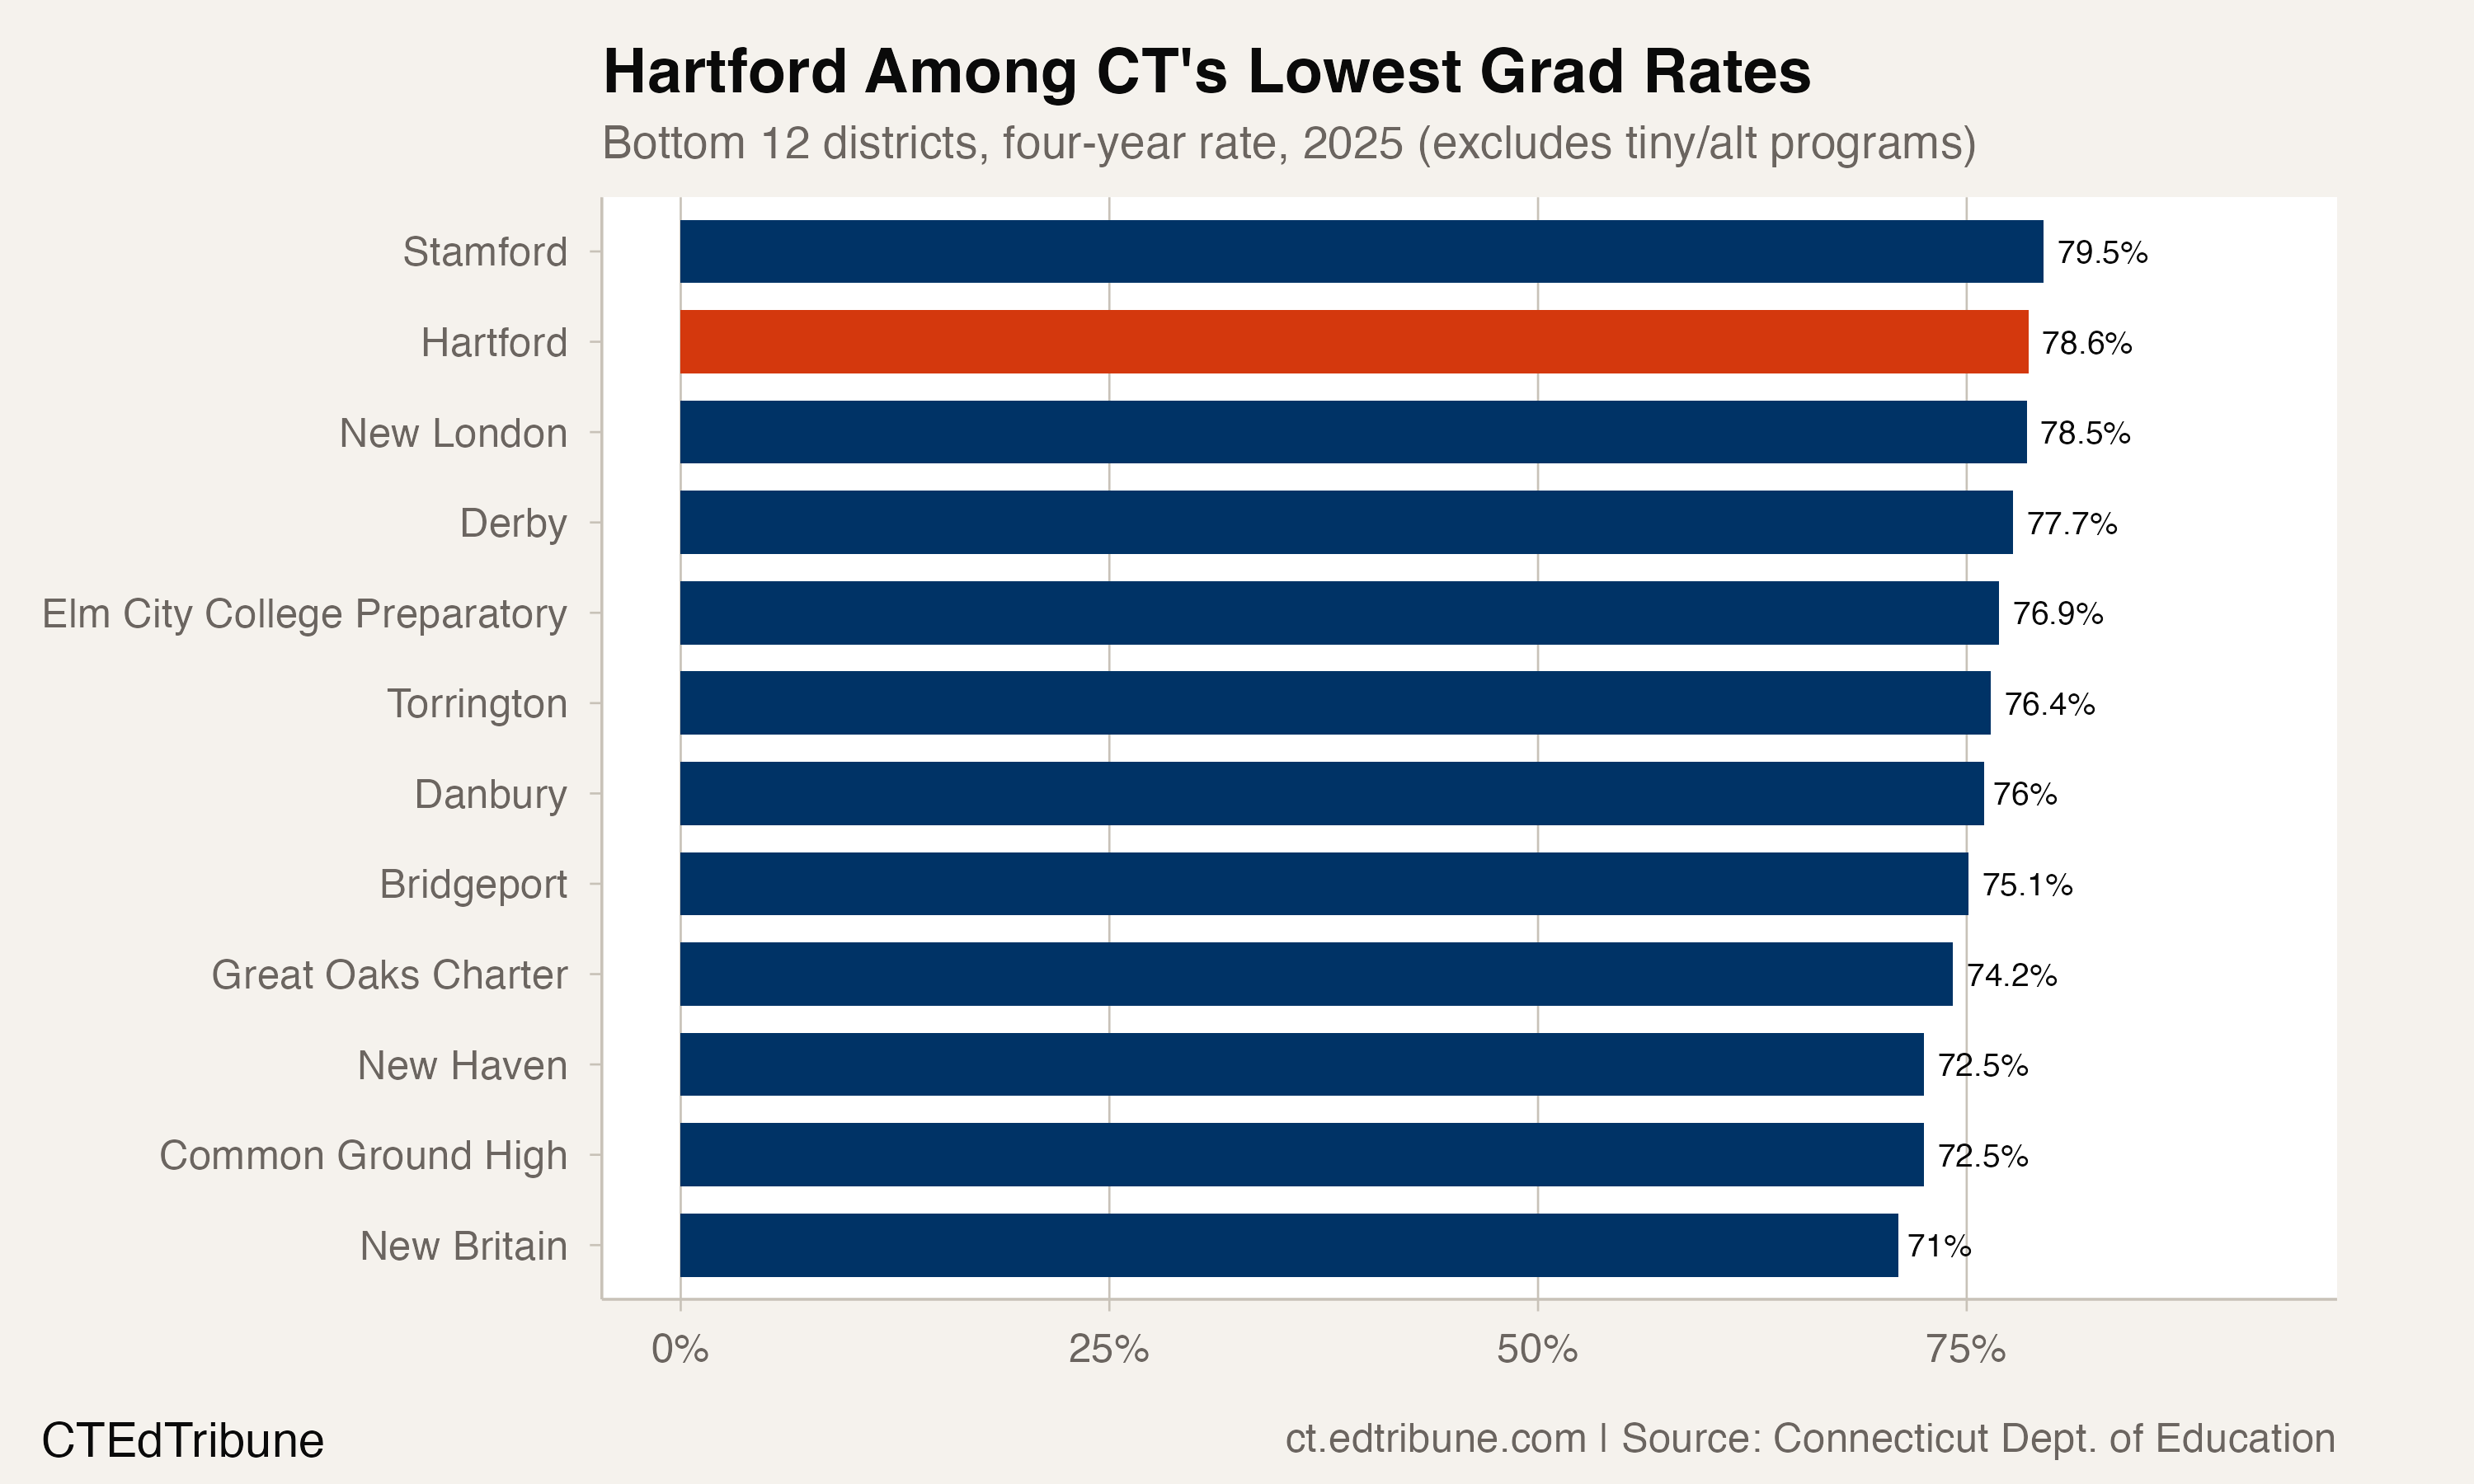
The ranking describes reported four-year rates. It does not measure literacy, course rigor, college readiness or employment outcomes.
Waterbury Had the Largest Long-Run Gain
Waterbury School District↗ET rose from 67.9% in 2015 to 85.7% in 2025, a 17.8-point increase. That was the largest gain among 130 districts with rates in both endpoint years.
Hartford rose 7.1 points over the same endpoints, ranking 16th among those 130 districts.
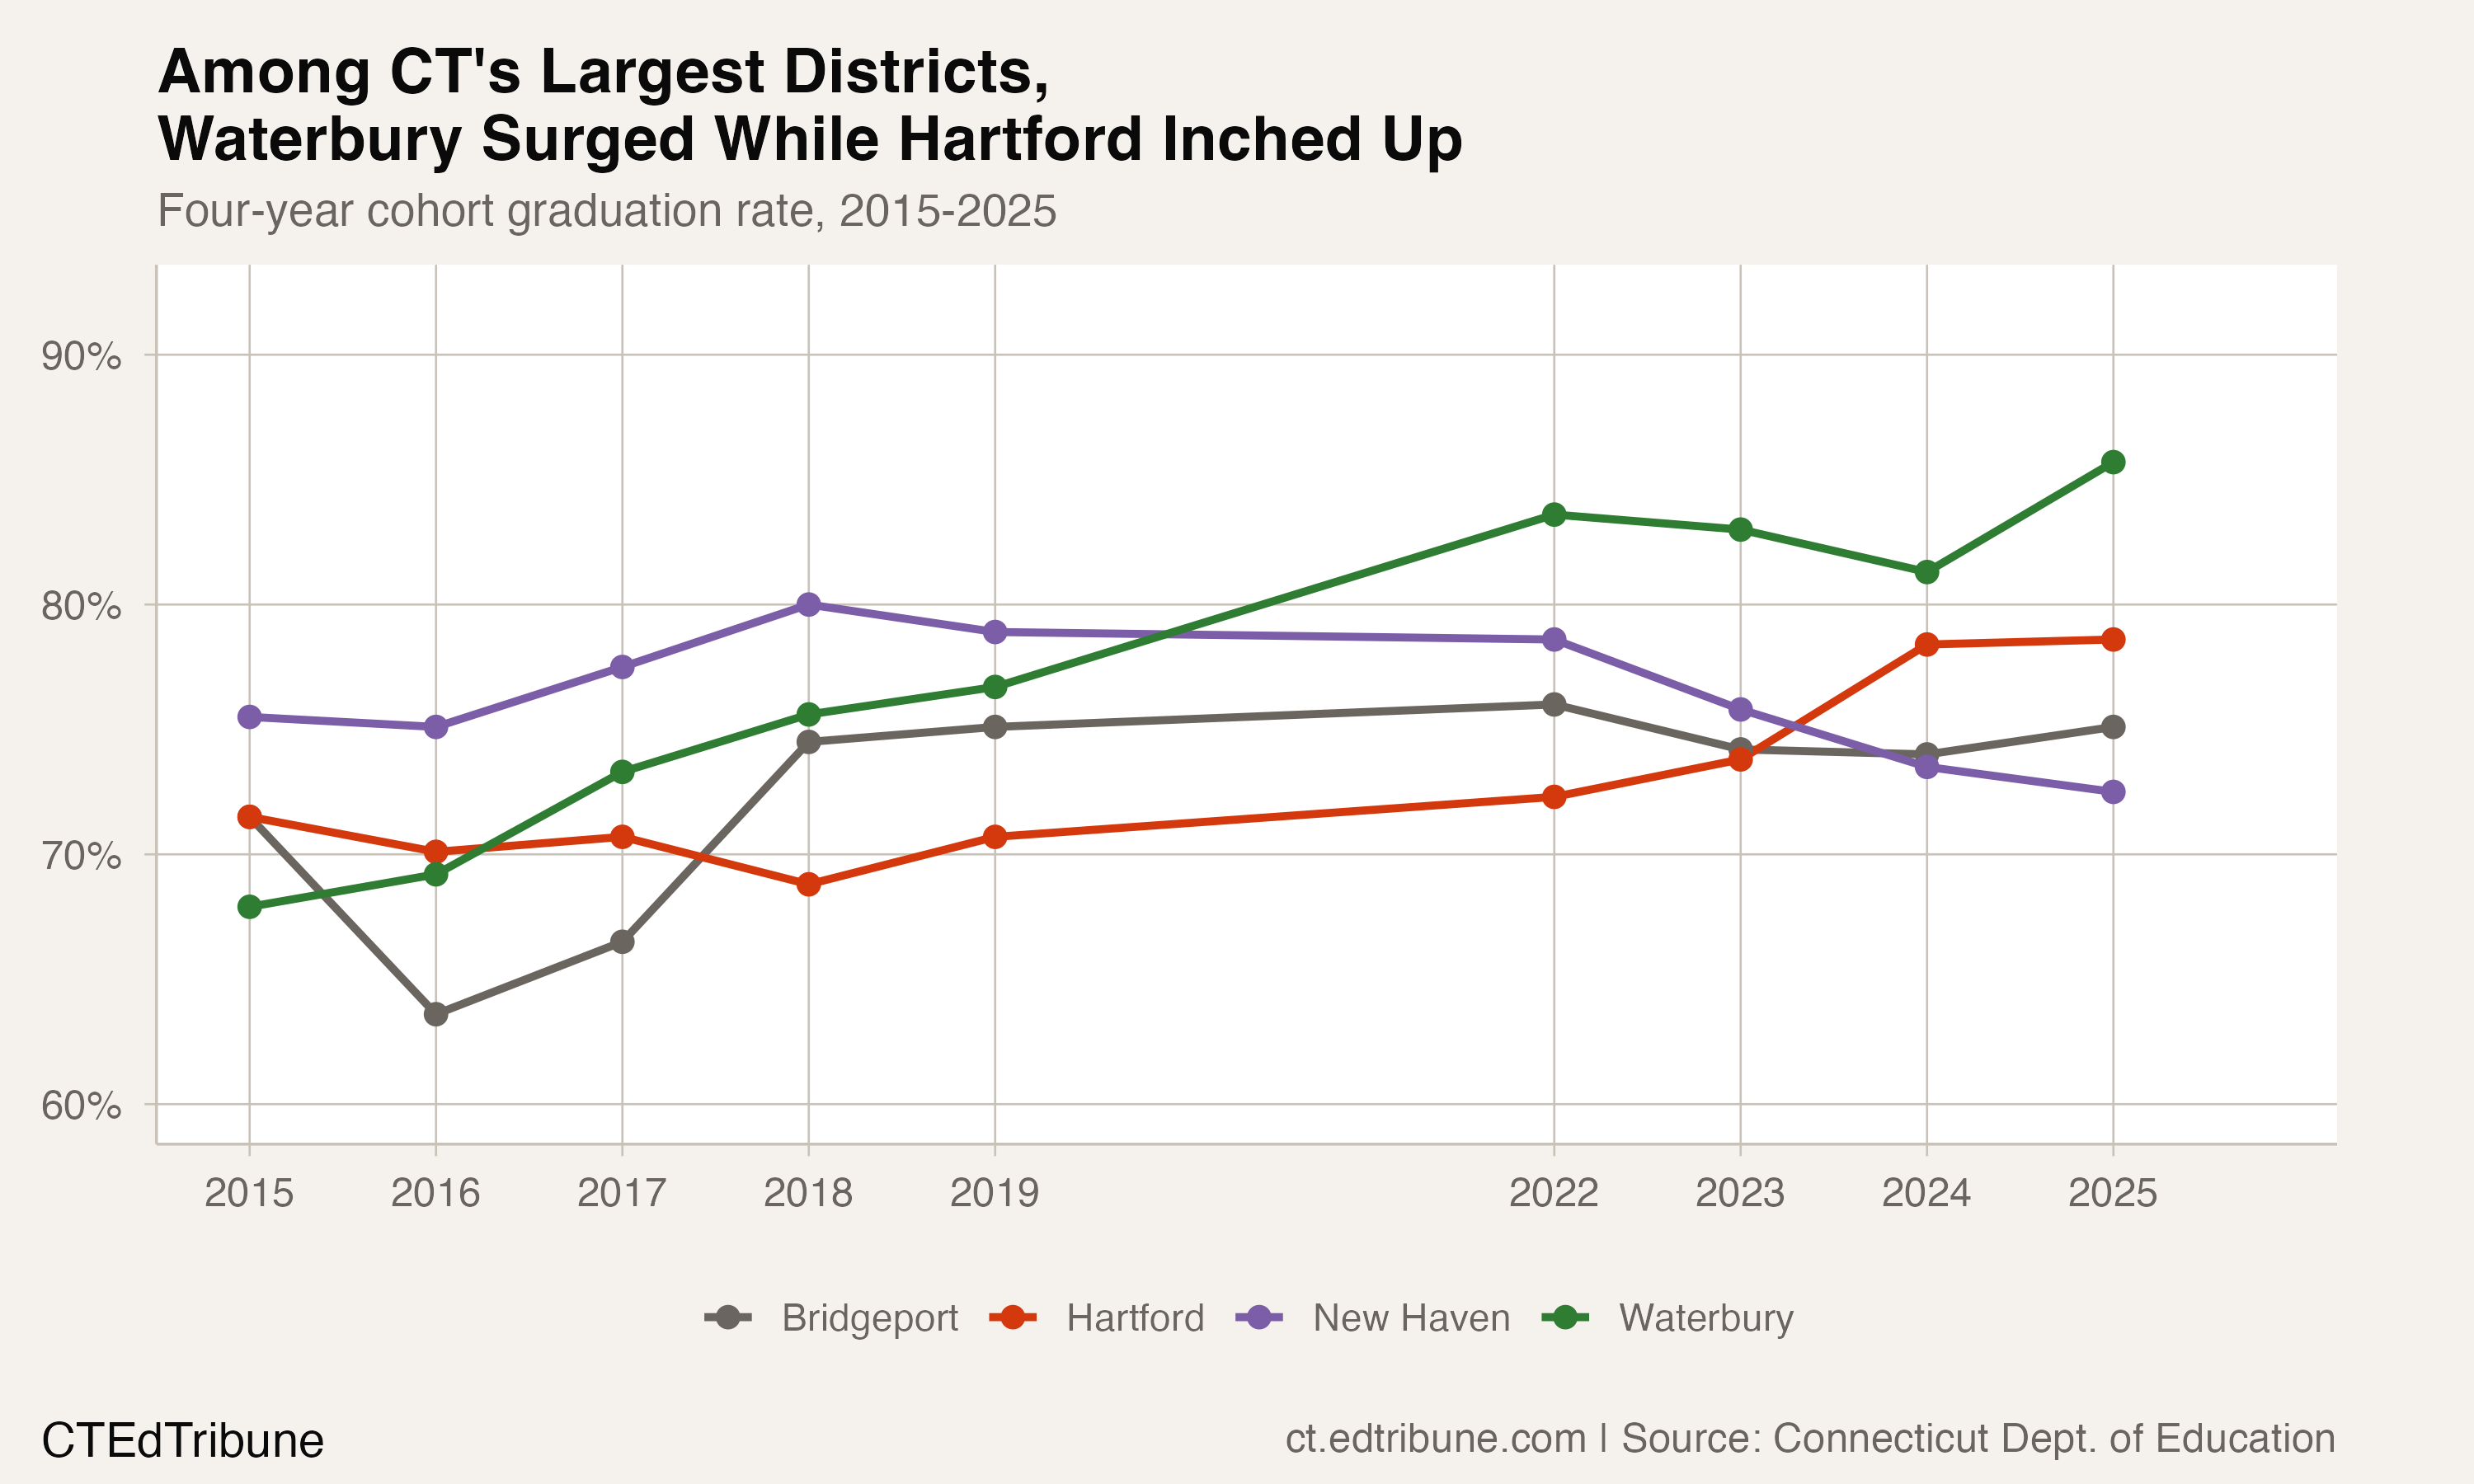
From 2019 to 2025, Waterbury gained 9.0 points and Hartford gained 7.9. Bridgeport School District↗ET was unchanged at 75.1% in both years. New Haven School District↗ET fell 6.4 points, from 78.9% to 72.5%.
Those trajectories establish how the reported rates moved. They do not identify which district policy or program caused the differences.
The West Hartford Gap Narrowed
West Hartford School District↗ET's rate was 92.2% in 2025, producing a 13.6-point gap with Hartford. The gap had been 24.4 points in 2018.
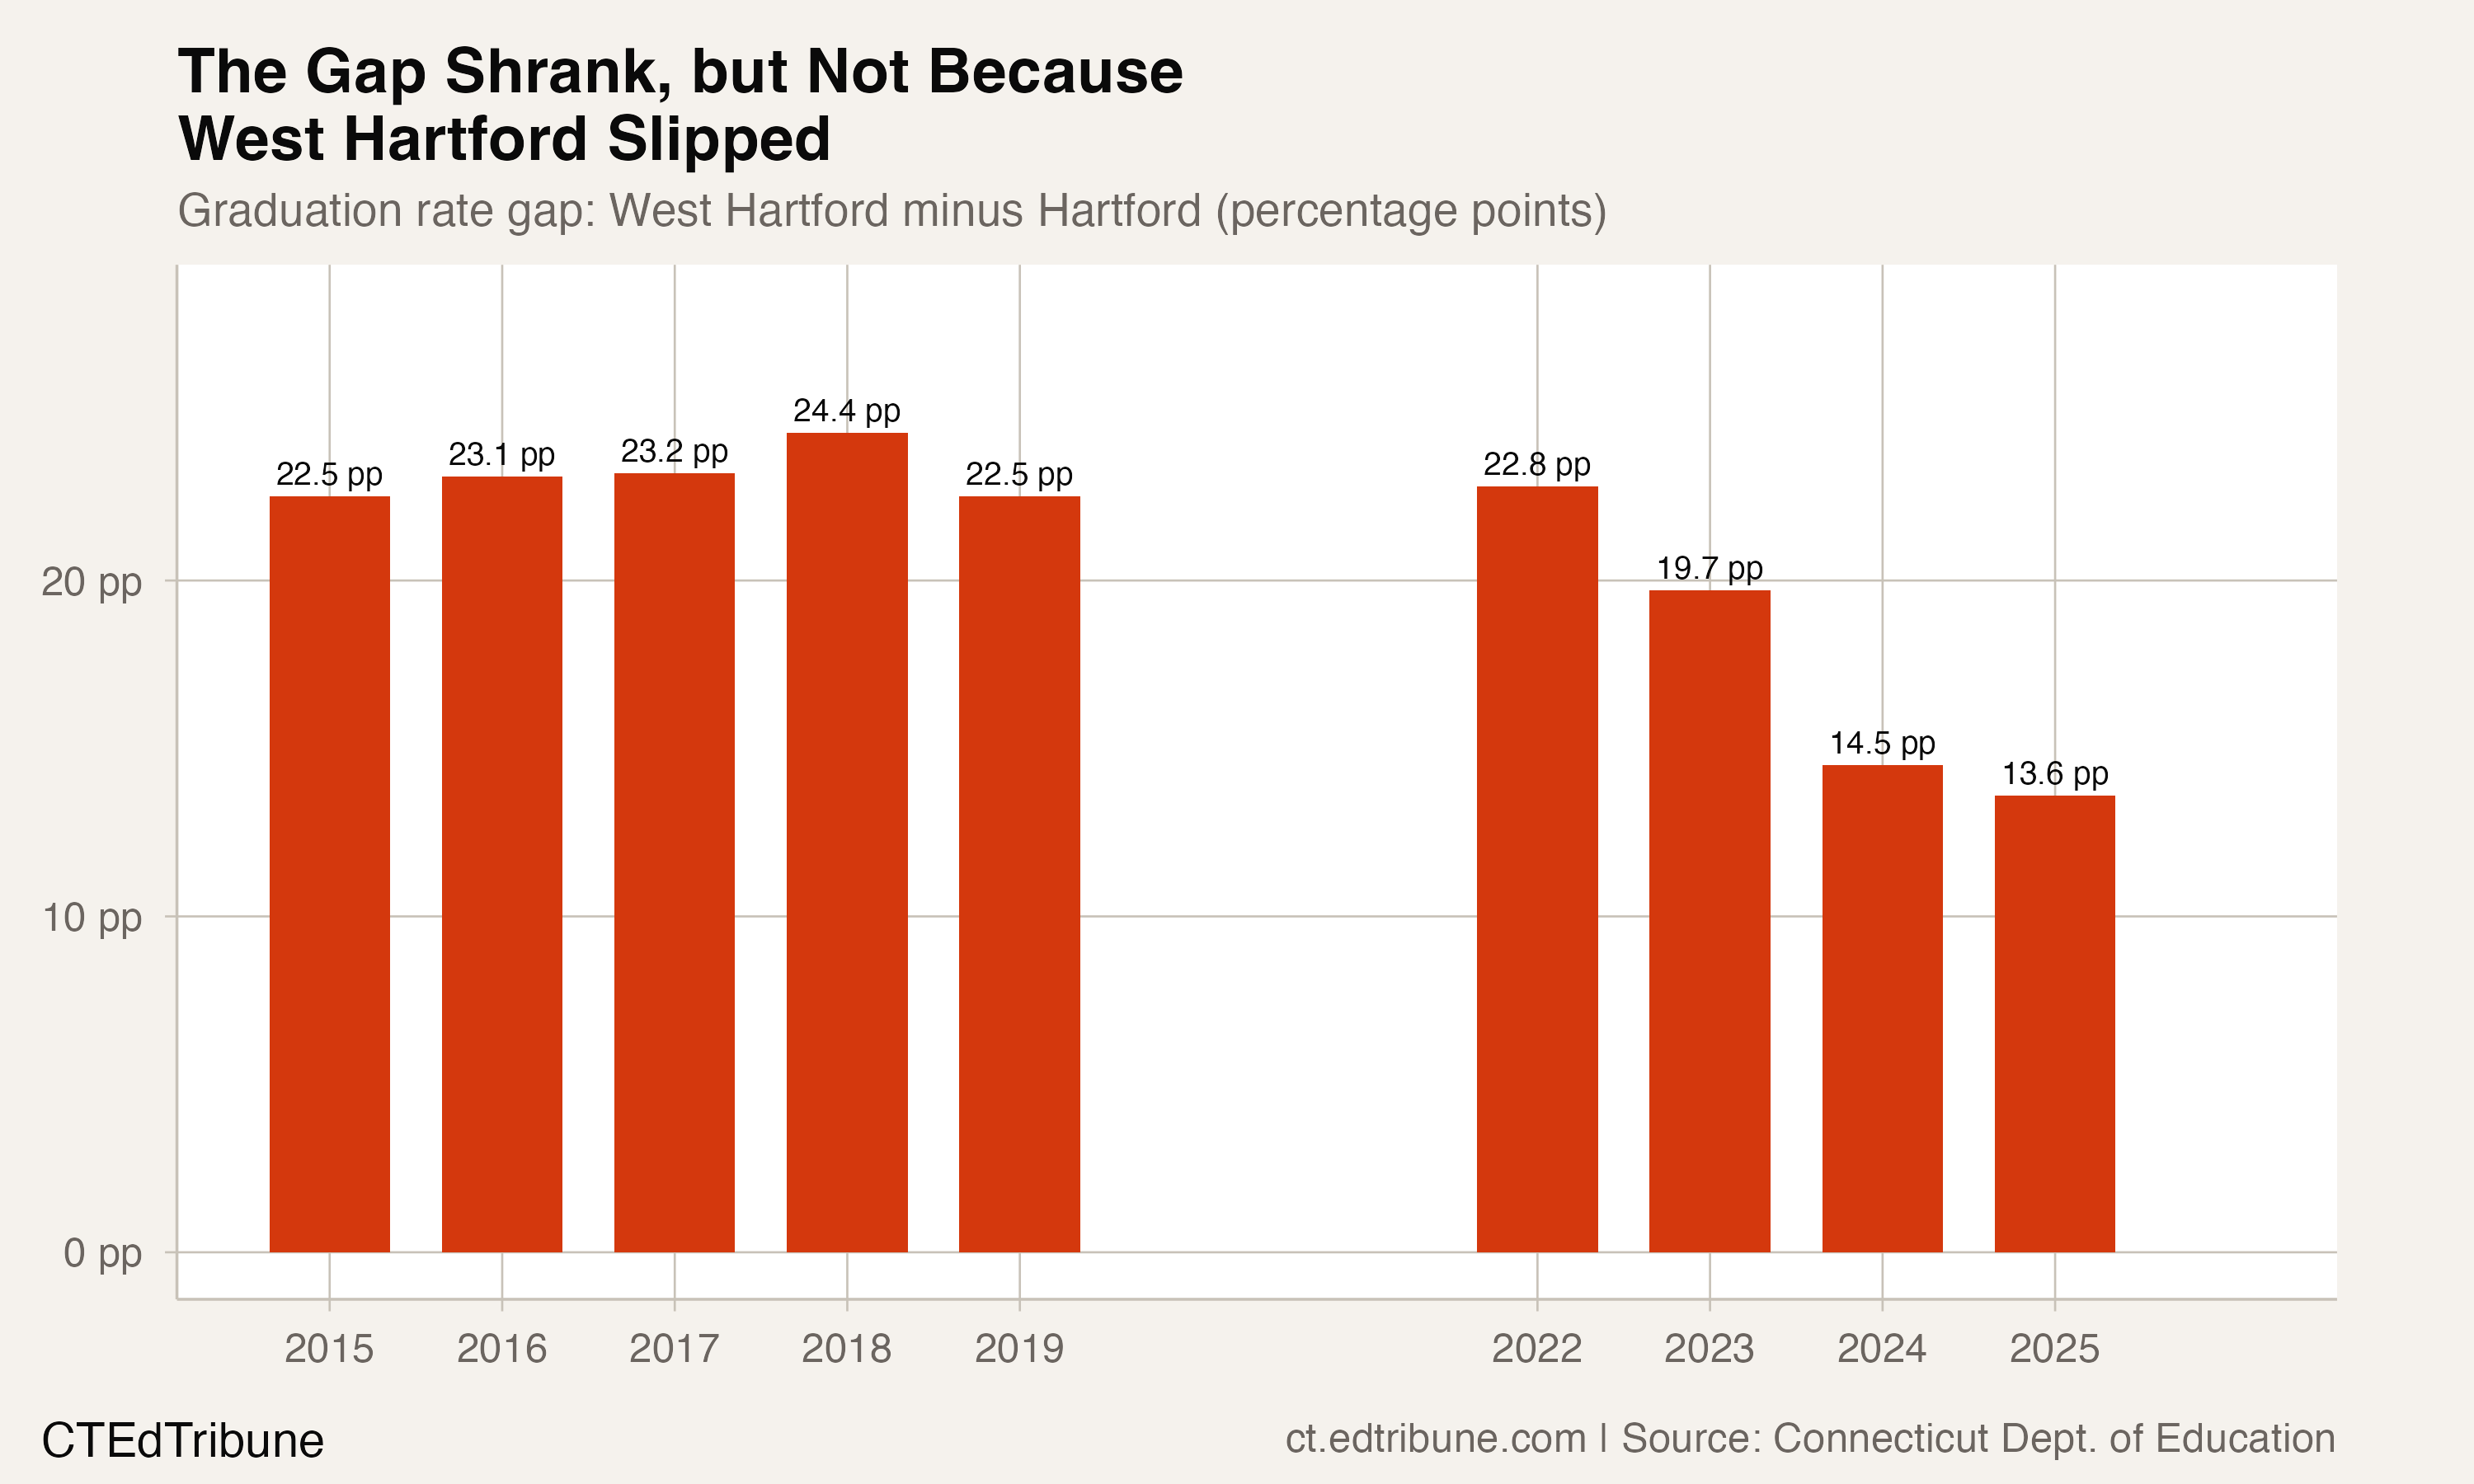
West Hartford reached 95.1% in 2022 before falling to 92.2% in 2025. Hartford's rate rose over the same available endpoints. The file does not test demographic, funding or instructional explanations for the remaining gap.
High-Needs and All-Student Rates Were Similar in Hartford
Hartford's 2025 high-needs rate was 78.7%, compared with 78.6% for all students. Statewide, the high-needs rate was 87.3% and the all-student rate was 88.9%.
The close Hartford rates are aggregate subgroup results. They do not show how many students were in each subgroup, how subgroup definitions overlap or whether individual students experienced equal outcomes.
What the Rate Measures
Connecticut's official Graduation & Beyond documentation defines the four-year adjusted cohort rate as the percentage of first-time ninth graders who receive a regular high school diploma within four years or less.
That definition is narrower than a claim about whether graduates can read, are ready for college or work, or benefited from a particular grading policy. This analysis verifies the cohort-rate trend and comparisons; it does not use the rate as evidence for those separate outcomes.
Detailed code that reproduces the analysis and figures in this article is available exclusively to EdTribune subscribers.
Discussion
Sign in to join the discussion.
Loading comments...