Correction (July 23, 2026): An earlier version said Hartford's graduation rate sat 14.7 points below Bloomfield's. The two rates, 78.6% and 83.3%, differ by 4.7 points; the figure has been corrected.
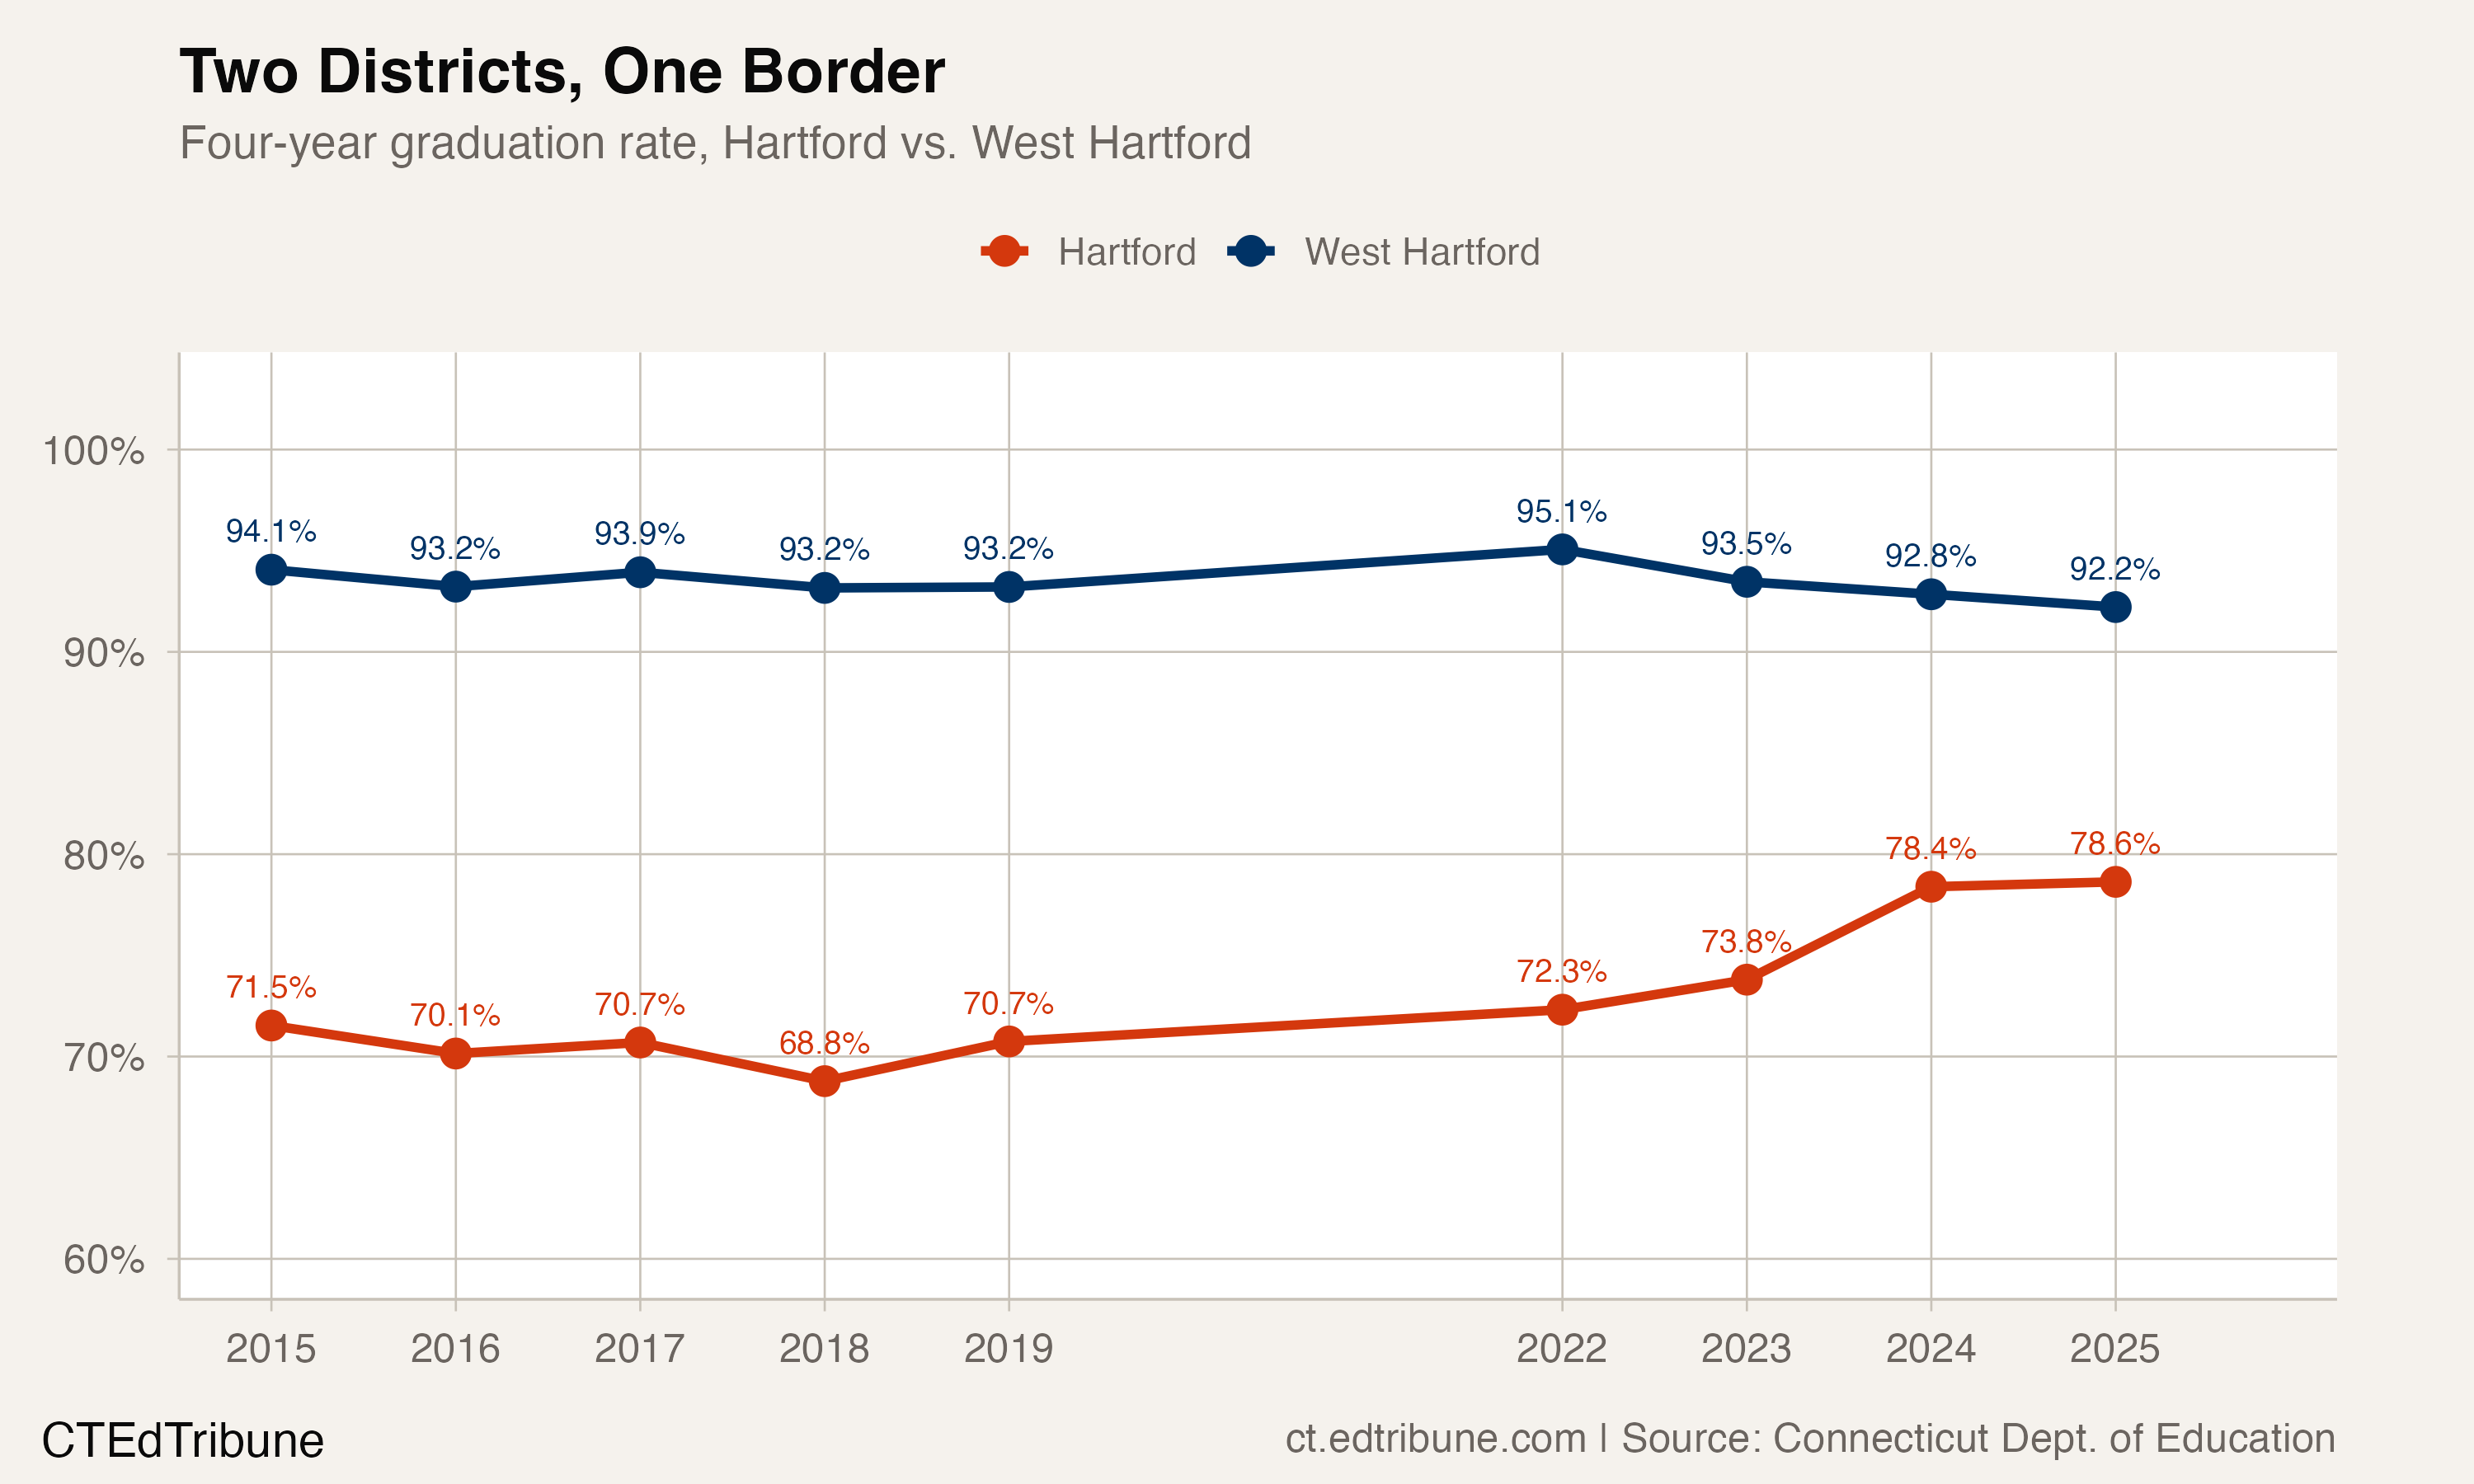
Walk north on Prospect Avenue from Hartford into West Hartford and the road does not change. The houses get a bit larger. The yards widen. Somewhere around the town line, before you notice anything different, the four-year graduation rate jumps from 78.6% to 92.2%.
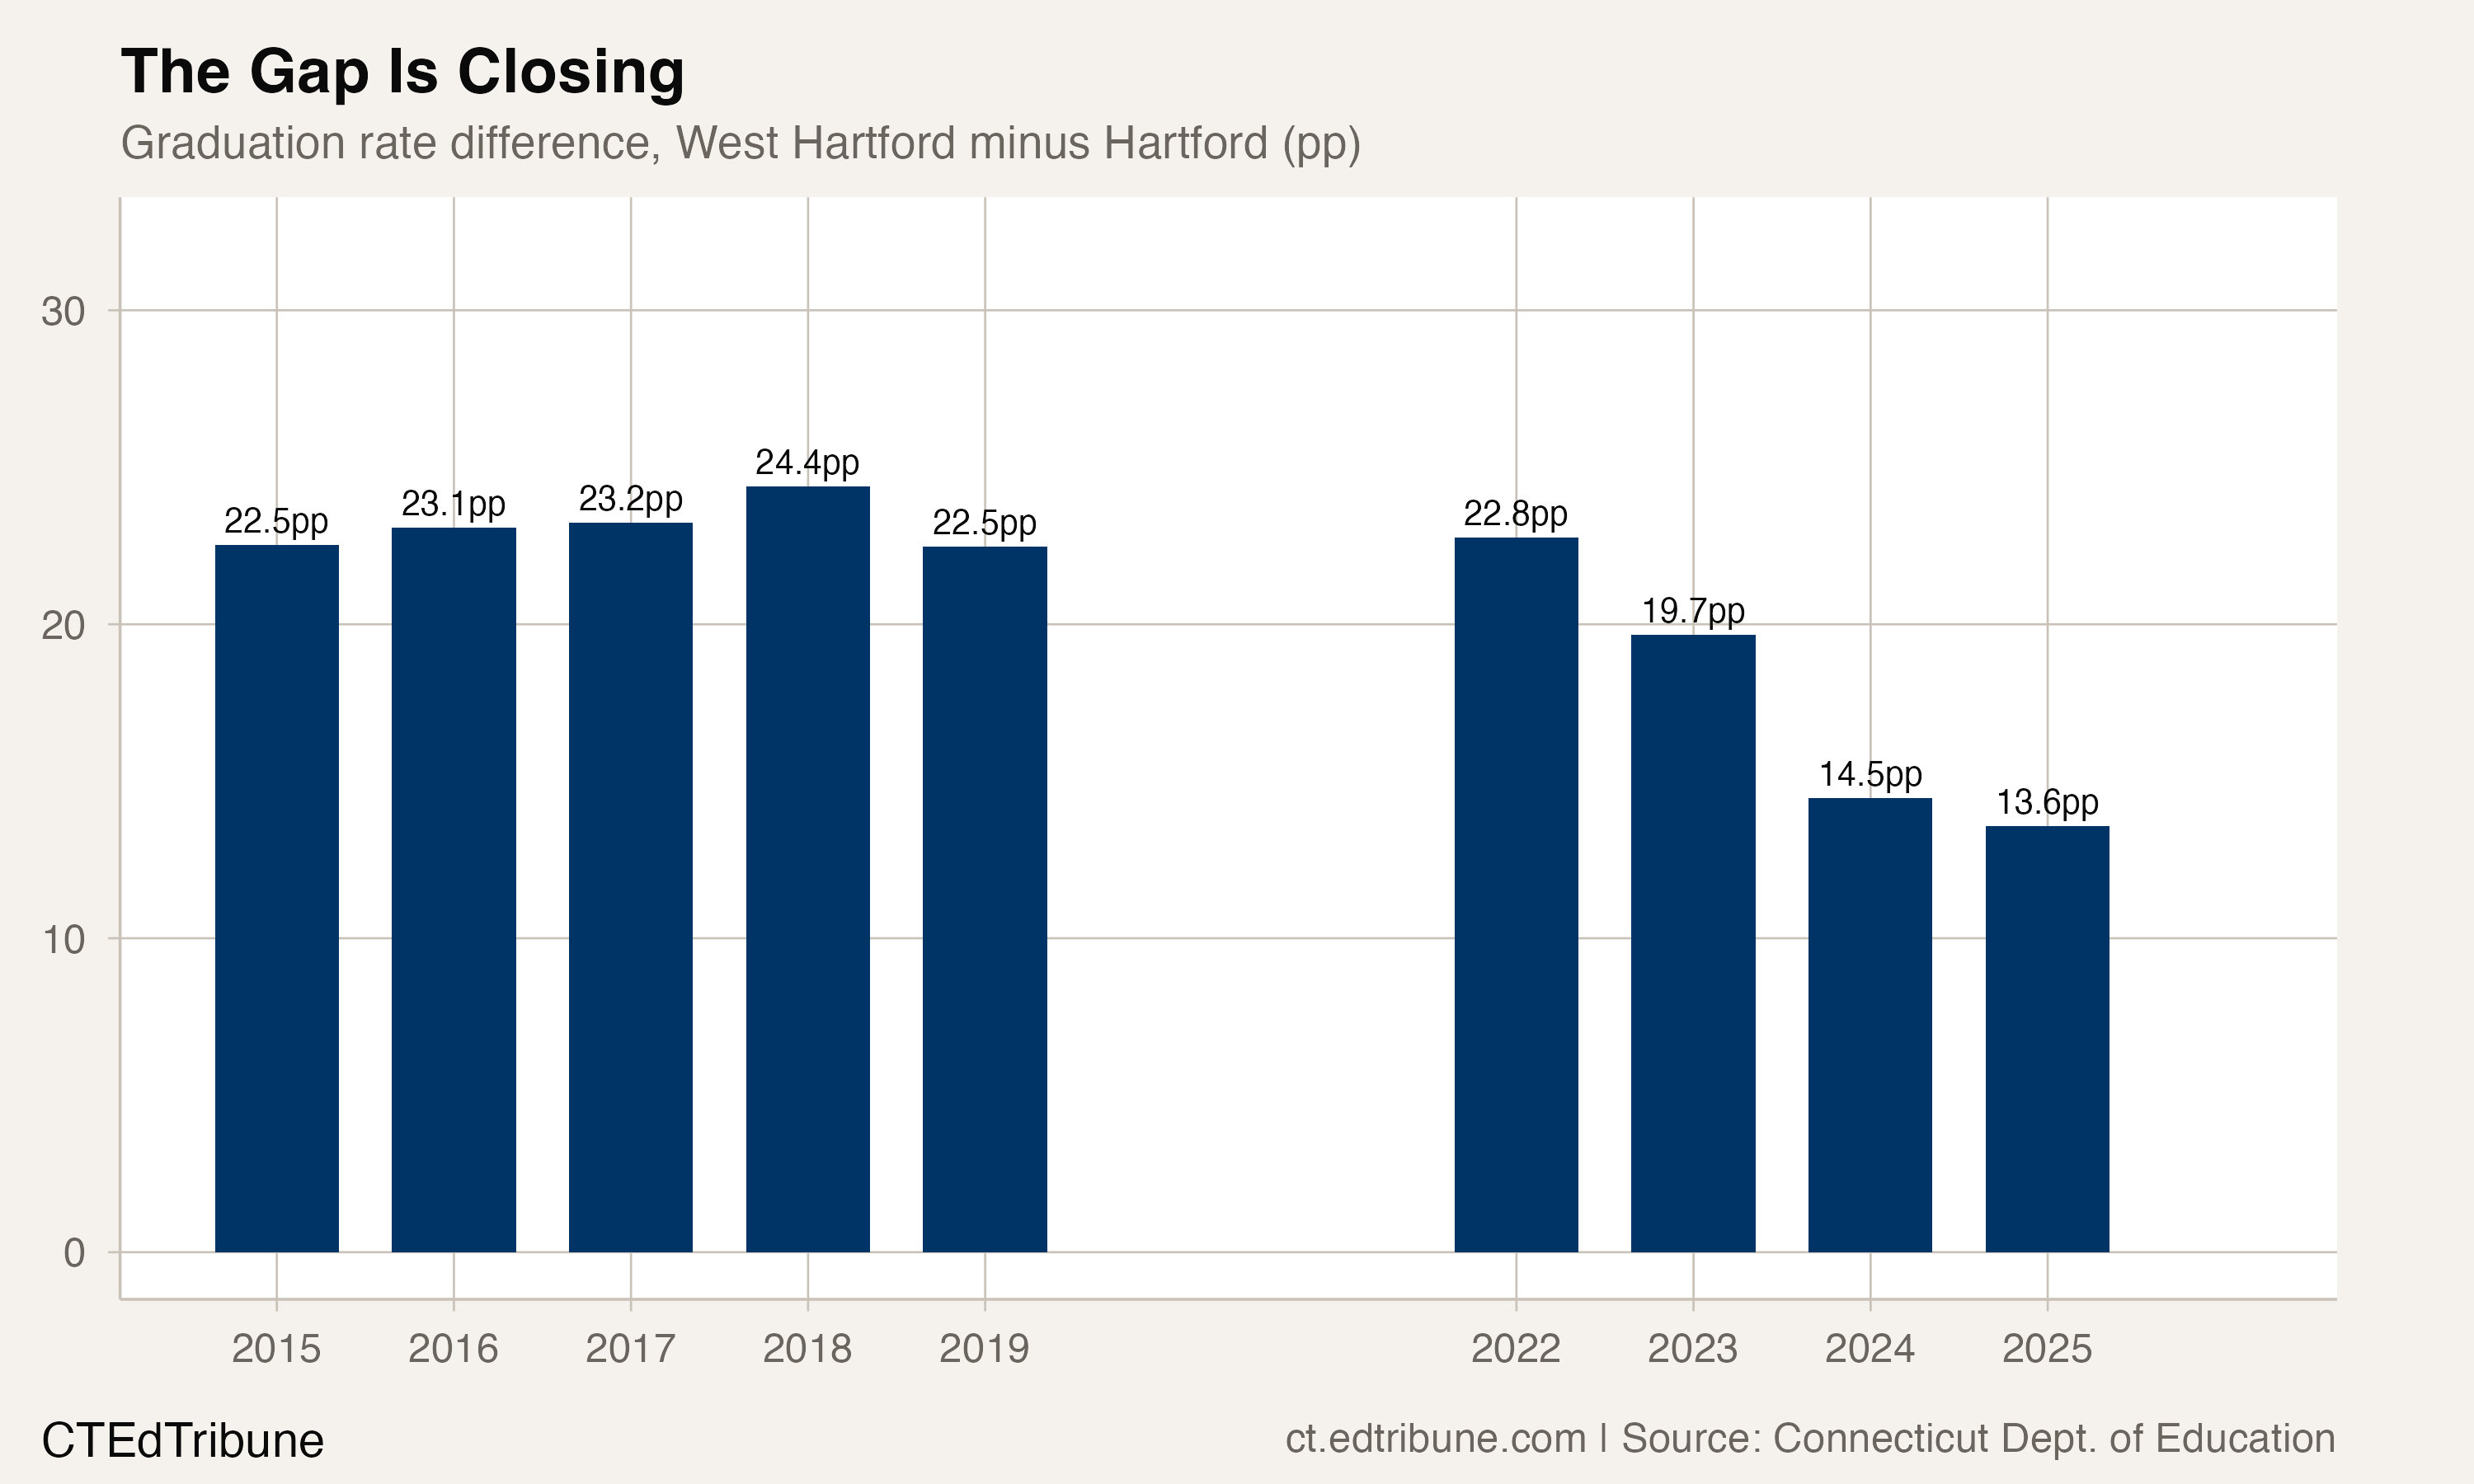
That 13.6 percentage-point gap is Connecticut's most visible education divide, two districts sharing a border and separated by a chasm in outcomes. But the gap used to be worse. In 2017-18, it was 24.4 points. In seven years, it has narrowed by nearly 11 points, and the story of how is almost entirely a Hartford story.
Hartford's climb, West Hartford's drift
Hartford↗ET graduated 68.8% of its 2017-18 cohort, the lowest point in the available data. By 2024-25, that figure reached 78.6%, a gain of 9.9 percentage points. The improvement accelerated after the pandemic: Hartford added 6.3 points between the 2021-22 and 2024-25 cohorts alone.
West Hartford↗ET, meanwhile, has drifted slightly downward. Its rate peaked at 95.1% in 2021-22 and has slipped to 92.2% in 2024-25, a decline of 2.9 points over three years. At 92.2%, West Hartford still graduates students at a rate above the state average of 88.9%. But the direction has reversed, and West Hartford now sits below several of its suburban peers.
The gap's compression is real, but it comes with an asterisk. Most of it reflects Hartford rising rather than both districts converging toward a middle. West Hartford's slight decline contributes about a third of the narrowing; Hartford's improvement accounts for the rest.
A ring of 90s around a city in the 70s
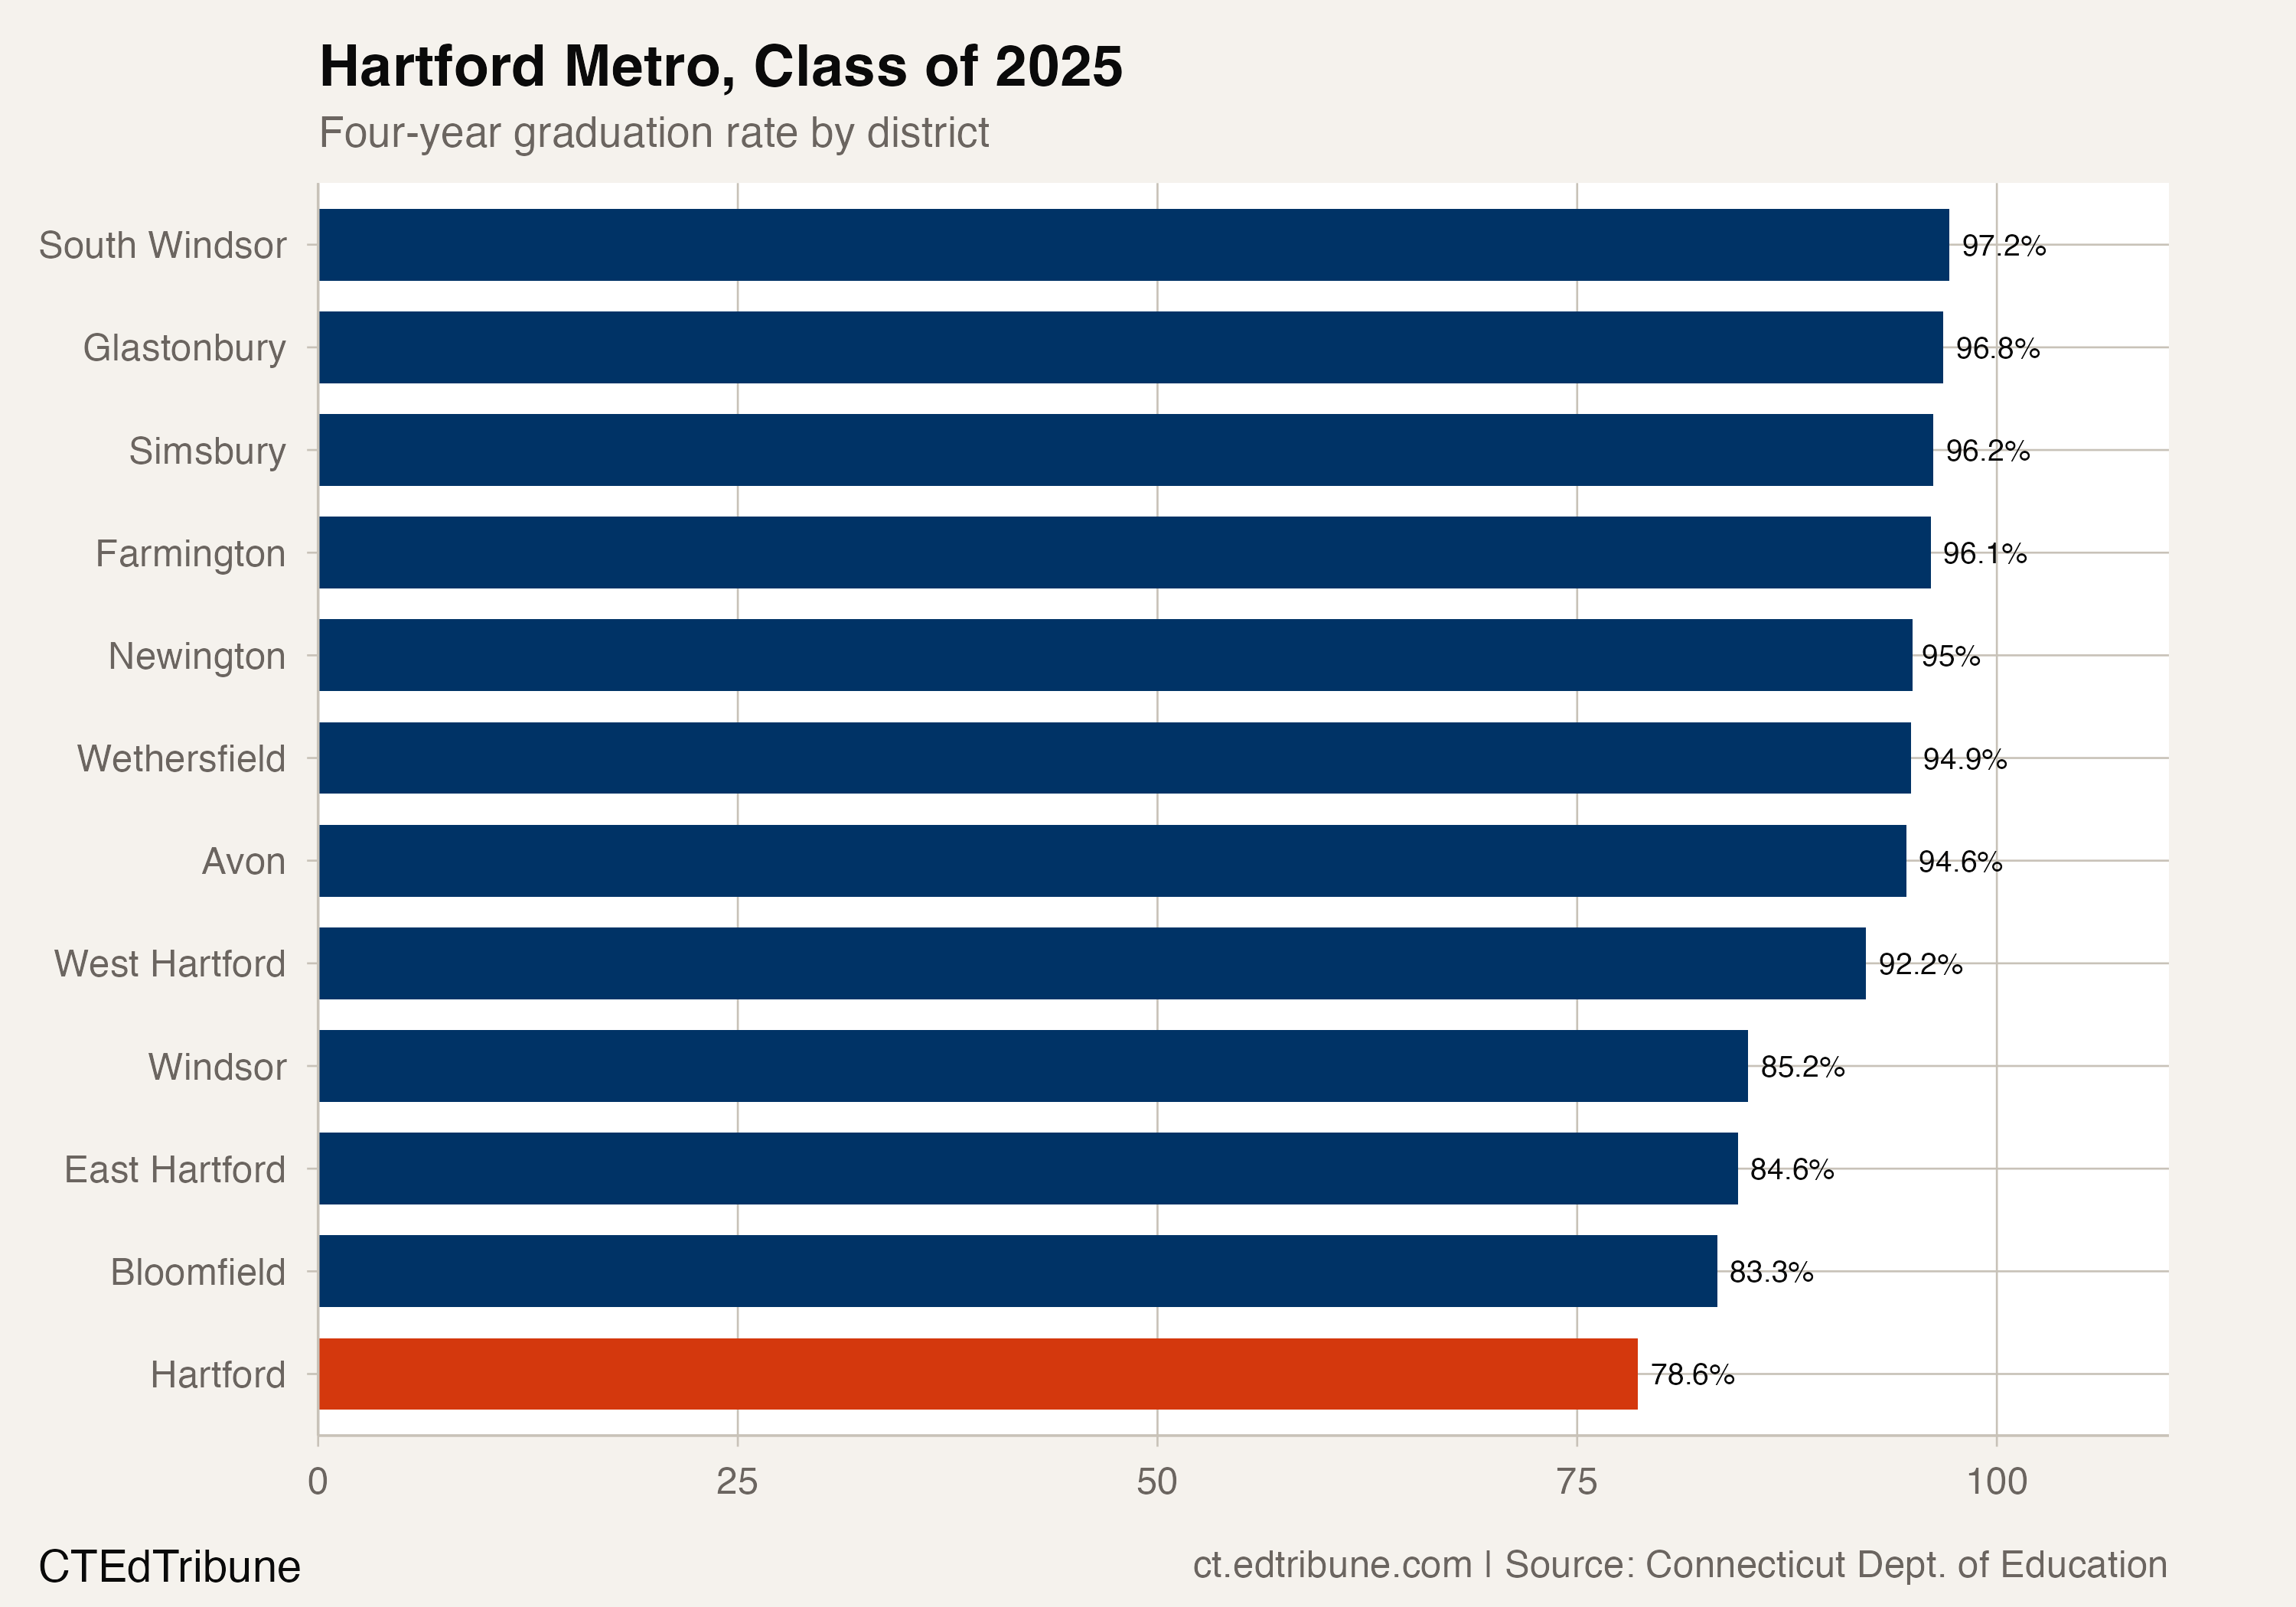
The Hartford metro area makes the divide concrete. Twelve districts share the metro geography. In 2024-25, seven of them graduated more than 94% of their students. South Windsor↗ET led at 97.2%, followed by Glastonbury↗ET at 96.8% and Simsbury at 96.2%. Hartford, at 78.6%, sits 4.7 points below the next-lowest suburban neighbor, Bloomfield↗ET at 83.3%.
The pattern mirrors what the Connecticut Supreme Court identified in its 1996 Sheff v. O'Neill ruling: that Hartford students were "racially, ethnically and economically isolated" in ways that denied them substantially equal educational opportunity. Three decades later, the desegregation remedies born from that ruling, including CREC magnet schools and the Open Choice program, have reshaped how Hartford students go to school. Over 56% of Hartford students now attend a magnet or Open Choice school. Whether those programs contributed to Hartford's graduation gains is a question the data cannot answer directly, but the timing of the acceleration, post-2022, coincides with the 2022 historic settlement that expanded magnet capacity.
Waterbury outpaced everyone
Hartford is not the only urban district climbing. Across Connecticut's largest cities, most have gained ground since 2014-15, and one has gained more than anyone.
Waterbury↗ET graduated 67.9% of its 2014-15 cohort. A decade later, the figure is 85.7%, a gain of 17.8 percentage points, the largest of any district in the state. Waterbury's high-needs subgroup has been even more striking: from 65.9% in 2014-15 to 90.8% in 2024-25, a 24.9-point surge that puts its high-needs graduation rate above most districts' overall rate.
Waterbury is one of Connecticut's 33 Alliance Districts, which receive additional state funding tied to accountability targets. The program's statewide results have been characterized as inconsistent, but Waterbury's trajectory stands apart. Its Learner Engagement Attendance Program (LEAP), deployed across seven schools, and the Waterbury Career Academy's 98.5% graduation rate suggest district-level implementation has mattered as much as the state funding stream.
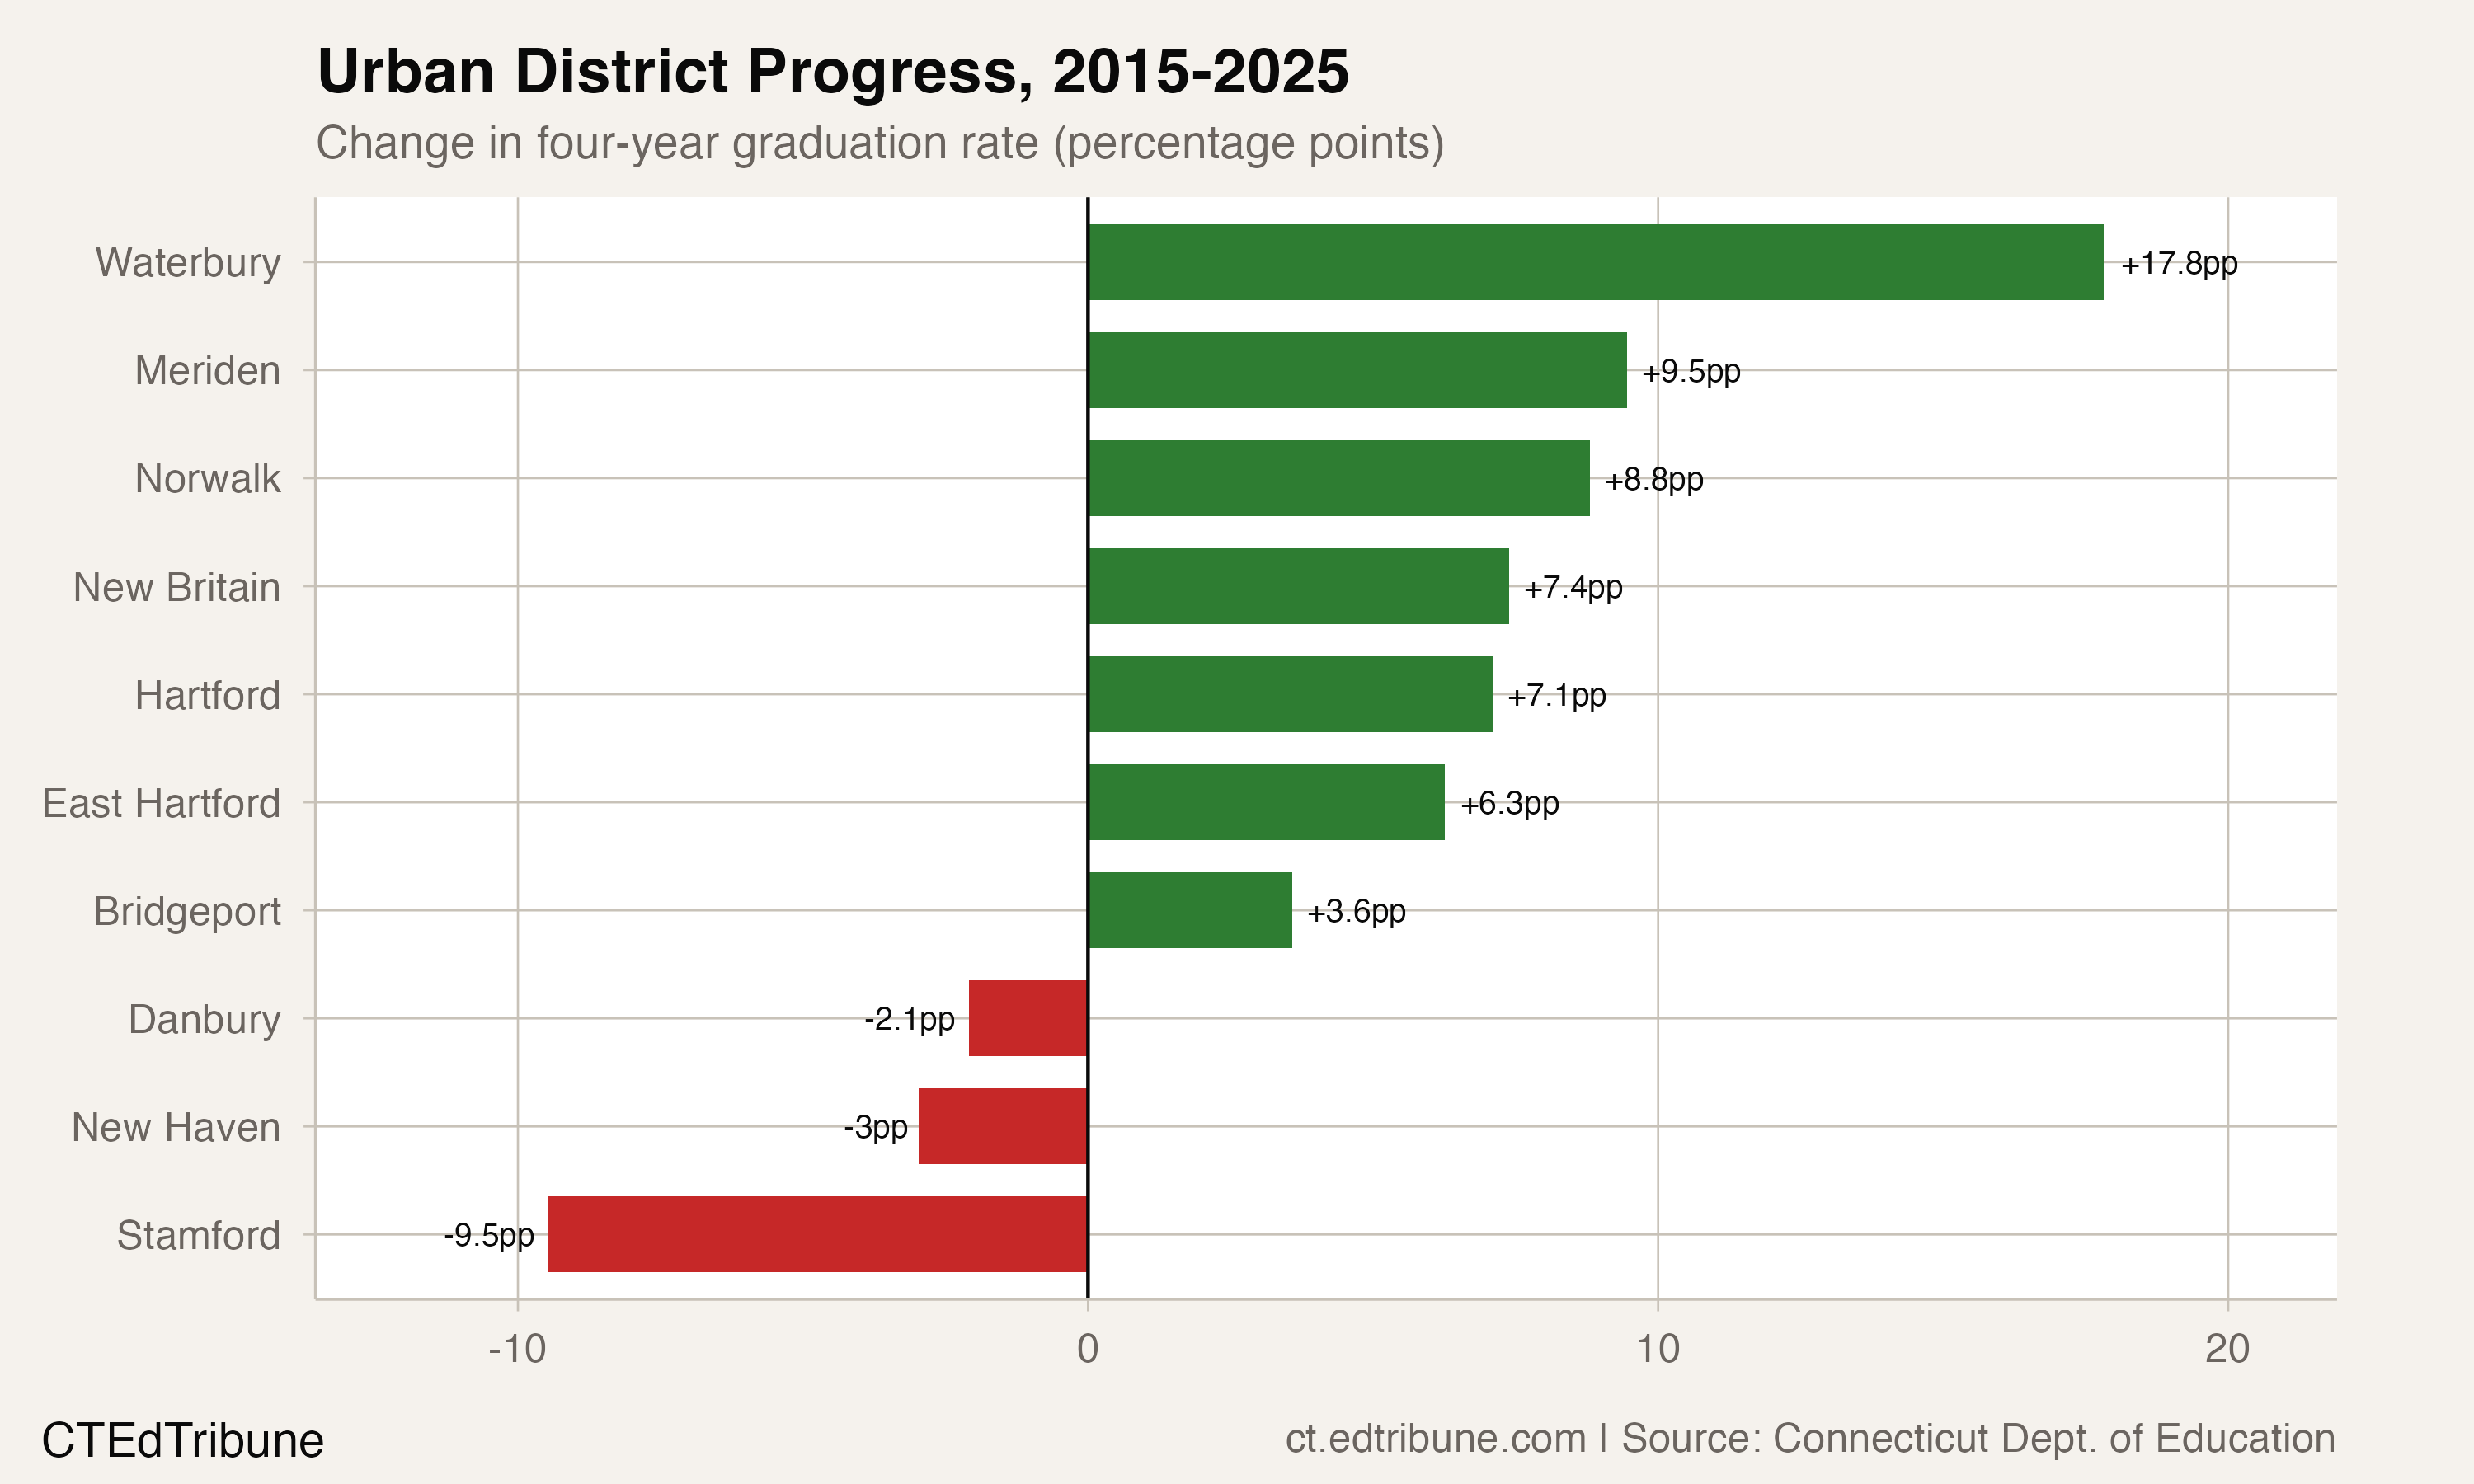
Not every city moved in the same direction. Stamford↗ET fell from 88.9% to 79.5%, a 9.5-point decline that dropped it below the state average for the first time in the data. New Haven slipped from 75.5% to 72.5%. These reversals complicate any narrative that Connecticut's urban schools are uniformly improving; the progress is concentrated, and the cities losing ground are losing it fast.
The high-needs test
One way to test whether the Hartford-West Hartford divide reflects district quality or student demographics is to compare the same subgroup across both districts. Connecticut reports graduation rates for "high needs" students, a category that includes economically disadvantaged students, English learners, and students with disabilities.
In 2024-25, Hartford's high-needs students graduated at 78.7%. West Hartford's high-needs students graduated at 92.5%. The gap: 13.8 points, nearly identical to the 13.6-point overall gap.
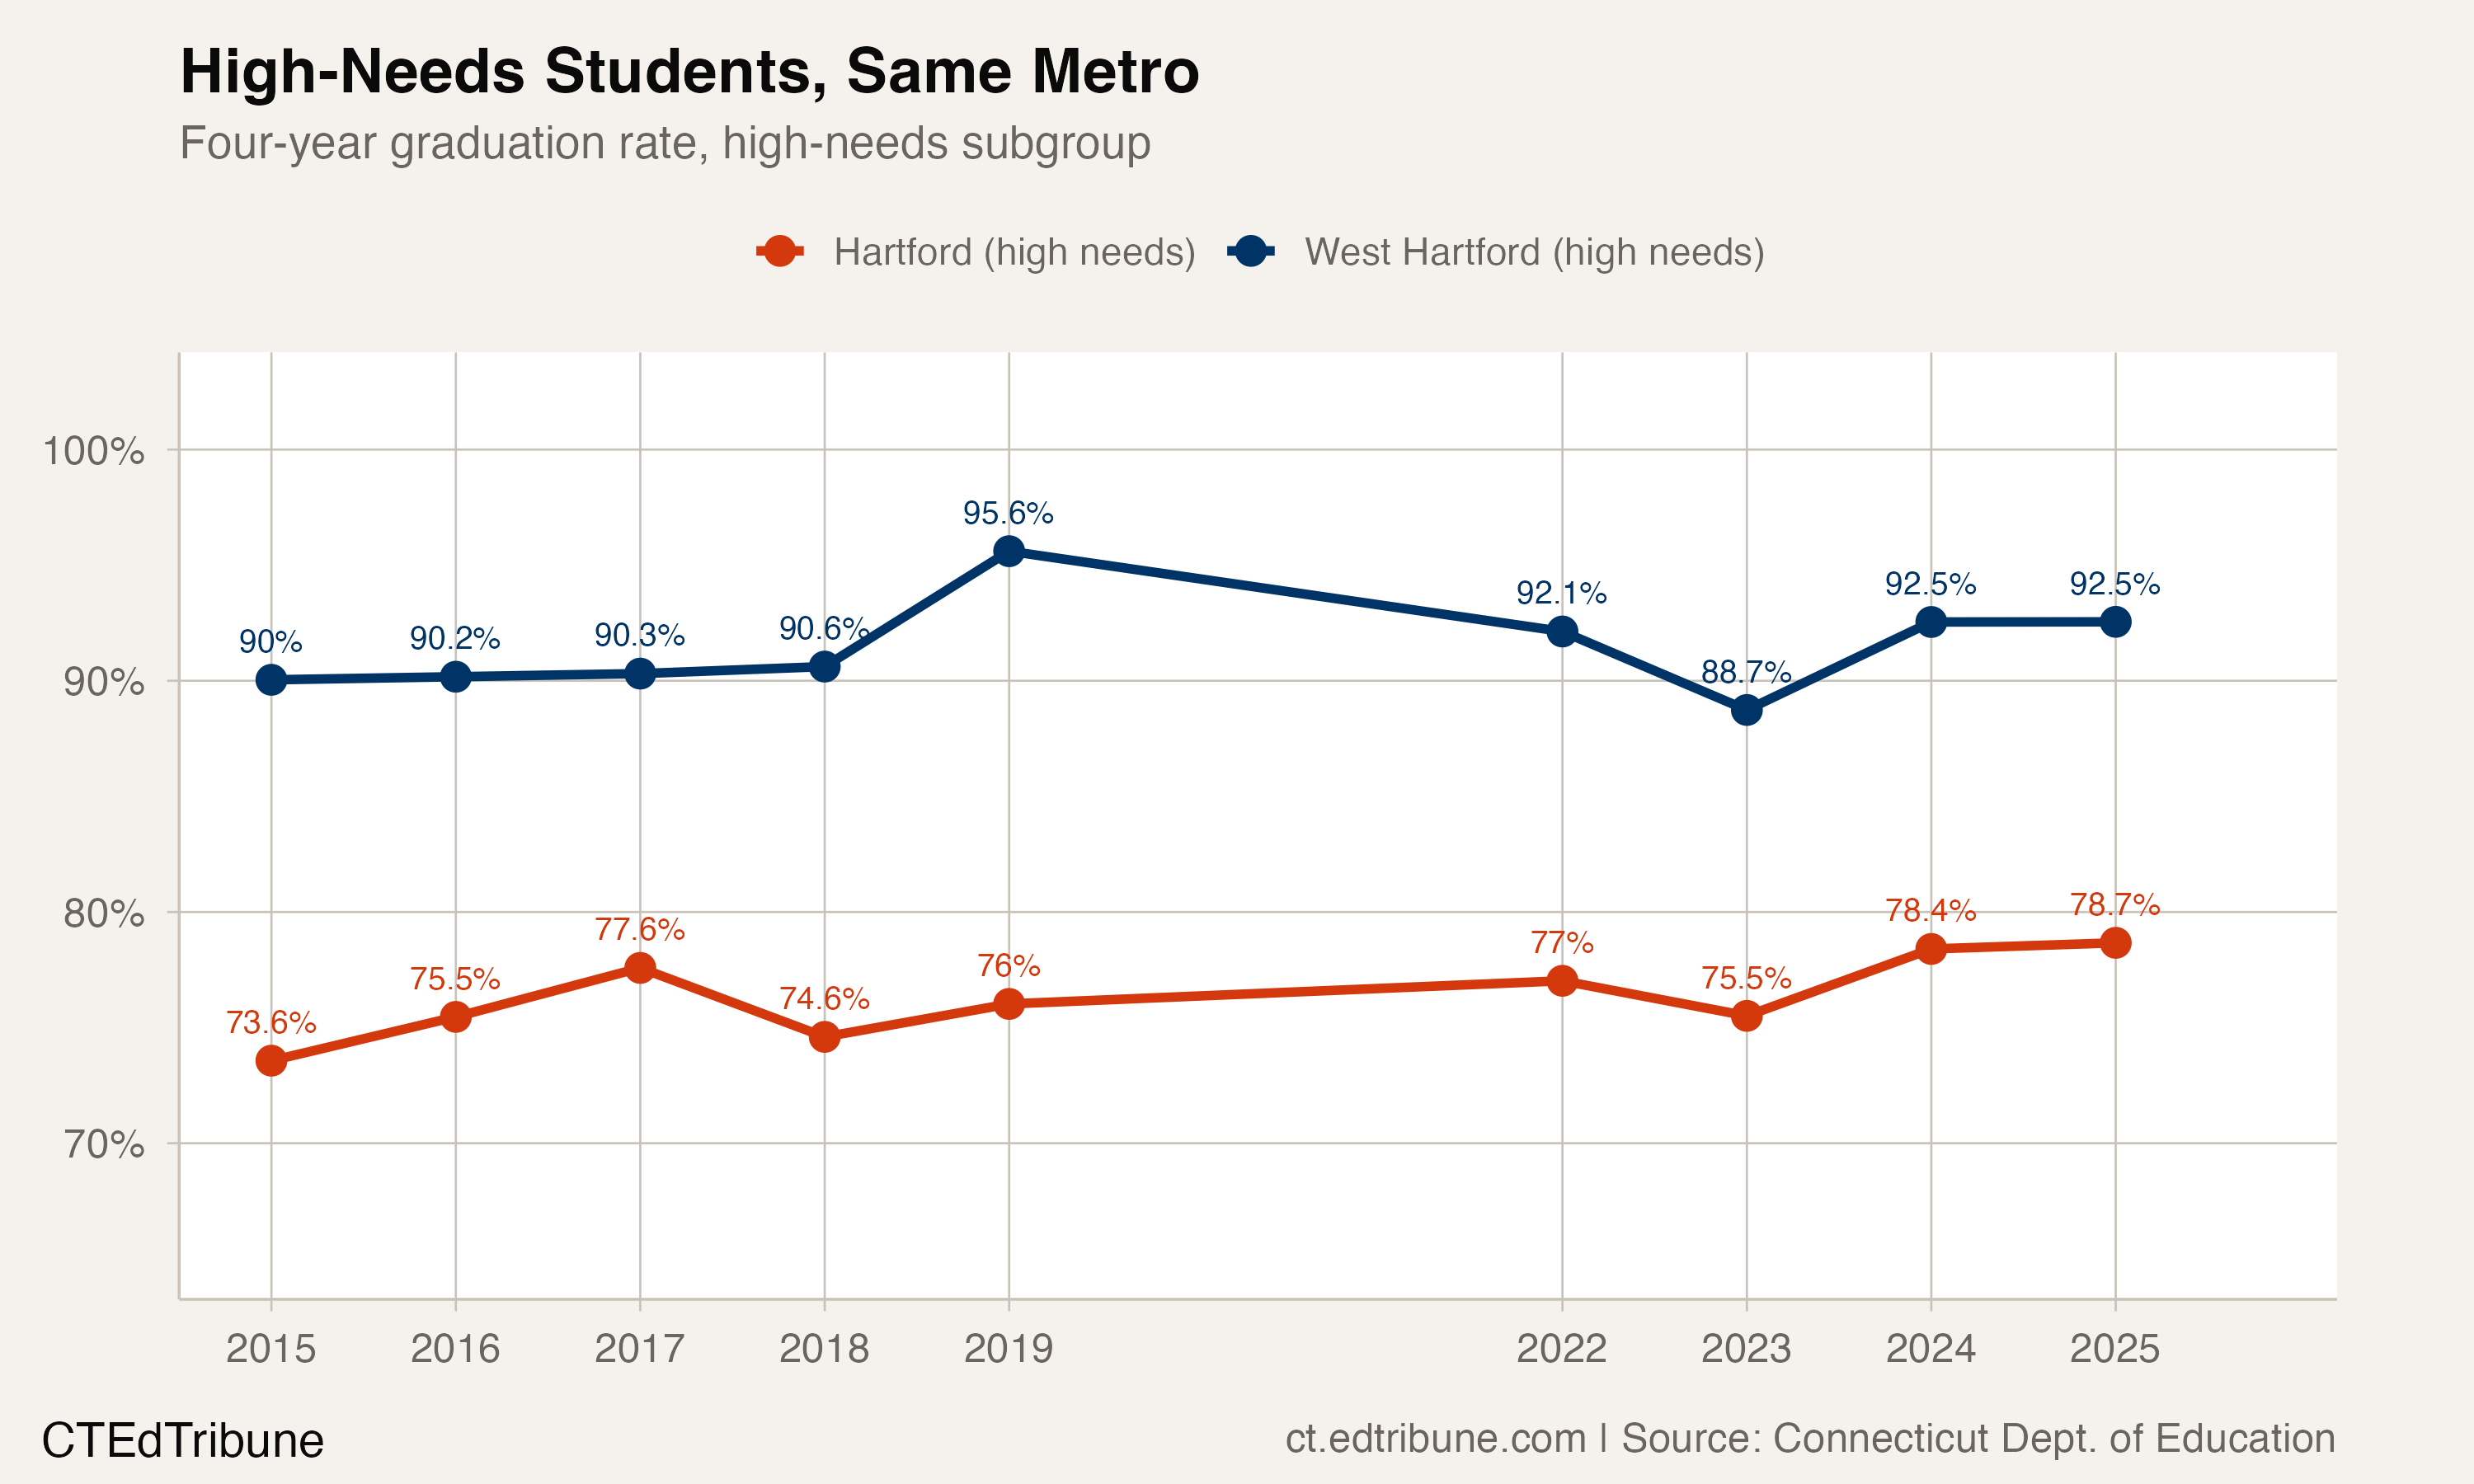
That parallel is notable. It means the gap is not explained by Hartford having more high-needs students dragging down an otherwise comparable rate. Even within the same demographic category, the difference persists. A high-needs student in West Hartford is substantially more likely to graduate than a high-needs student across the town line, though the composition of the high-needs population likely differs between the two districts in ways the data does not reveal.
The high-needs comparison also shows that Hartford's improvement has come primarily from this group. Hartford's high-needs rate rose from 73.6% in 2014-15 to 78.7% in 2024-25, and its overall rate tracked almost identically, suggesting most of Hartford's students fall into the high-needs category. The fact that Hartford has raised this rate while serving an overwhelmingly high-needs population is, from a policy perspective, the more significant achievement than the headline gap.
What 14 points looks like from here
Connecticut ranked third worst in the nation for education equality along racial lines in a 2023 WalletHub study. The Hartford-West Hartford border is the state's most compact illustration of why. Two communities that share grocery stores, bus routes, and a metro economy produce graduation outcomes separated by the width of a small district's entire range.
The encouraging signal is the direction. A decade ago, the gap was widening, reaching 24.4 points in 2017-18. It has since closed by nearly 11 points, mostly because Hartford kept climbing while the state plateaued. If Hartford sustains its trajectory, an 80% graduation rate, a floor that the city has never reached in the available data, is within range for the next cohort.
The less encouraging signal is what narrowing means at West Hartford's end. West Hartford's rate has dropped in three consecutive years, from 95.1% to 92.2%. A gap can close because the bottom rises, because the top falls, or both. Connecticut needs to answer which of those is happening before calling this progress.
RELATED: Hartford Lost One in Four Students, and Its #1 RankingET
Detailed code that reproduces the analysis and figures in this article is available exclusively to EdTribune subscribers.
Discussion
Sign in to join the discussion.
Loading comments...