Correction (July 21, 2026): The original article said approximately 23% of New Britain students received special education services and described their costs without a source that supported either claim. It also presented a historical local-funding comparison as a current rank without the source's caveat about missing Hartford data. Those statements have been removed.
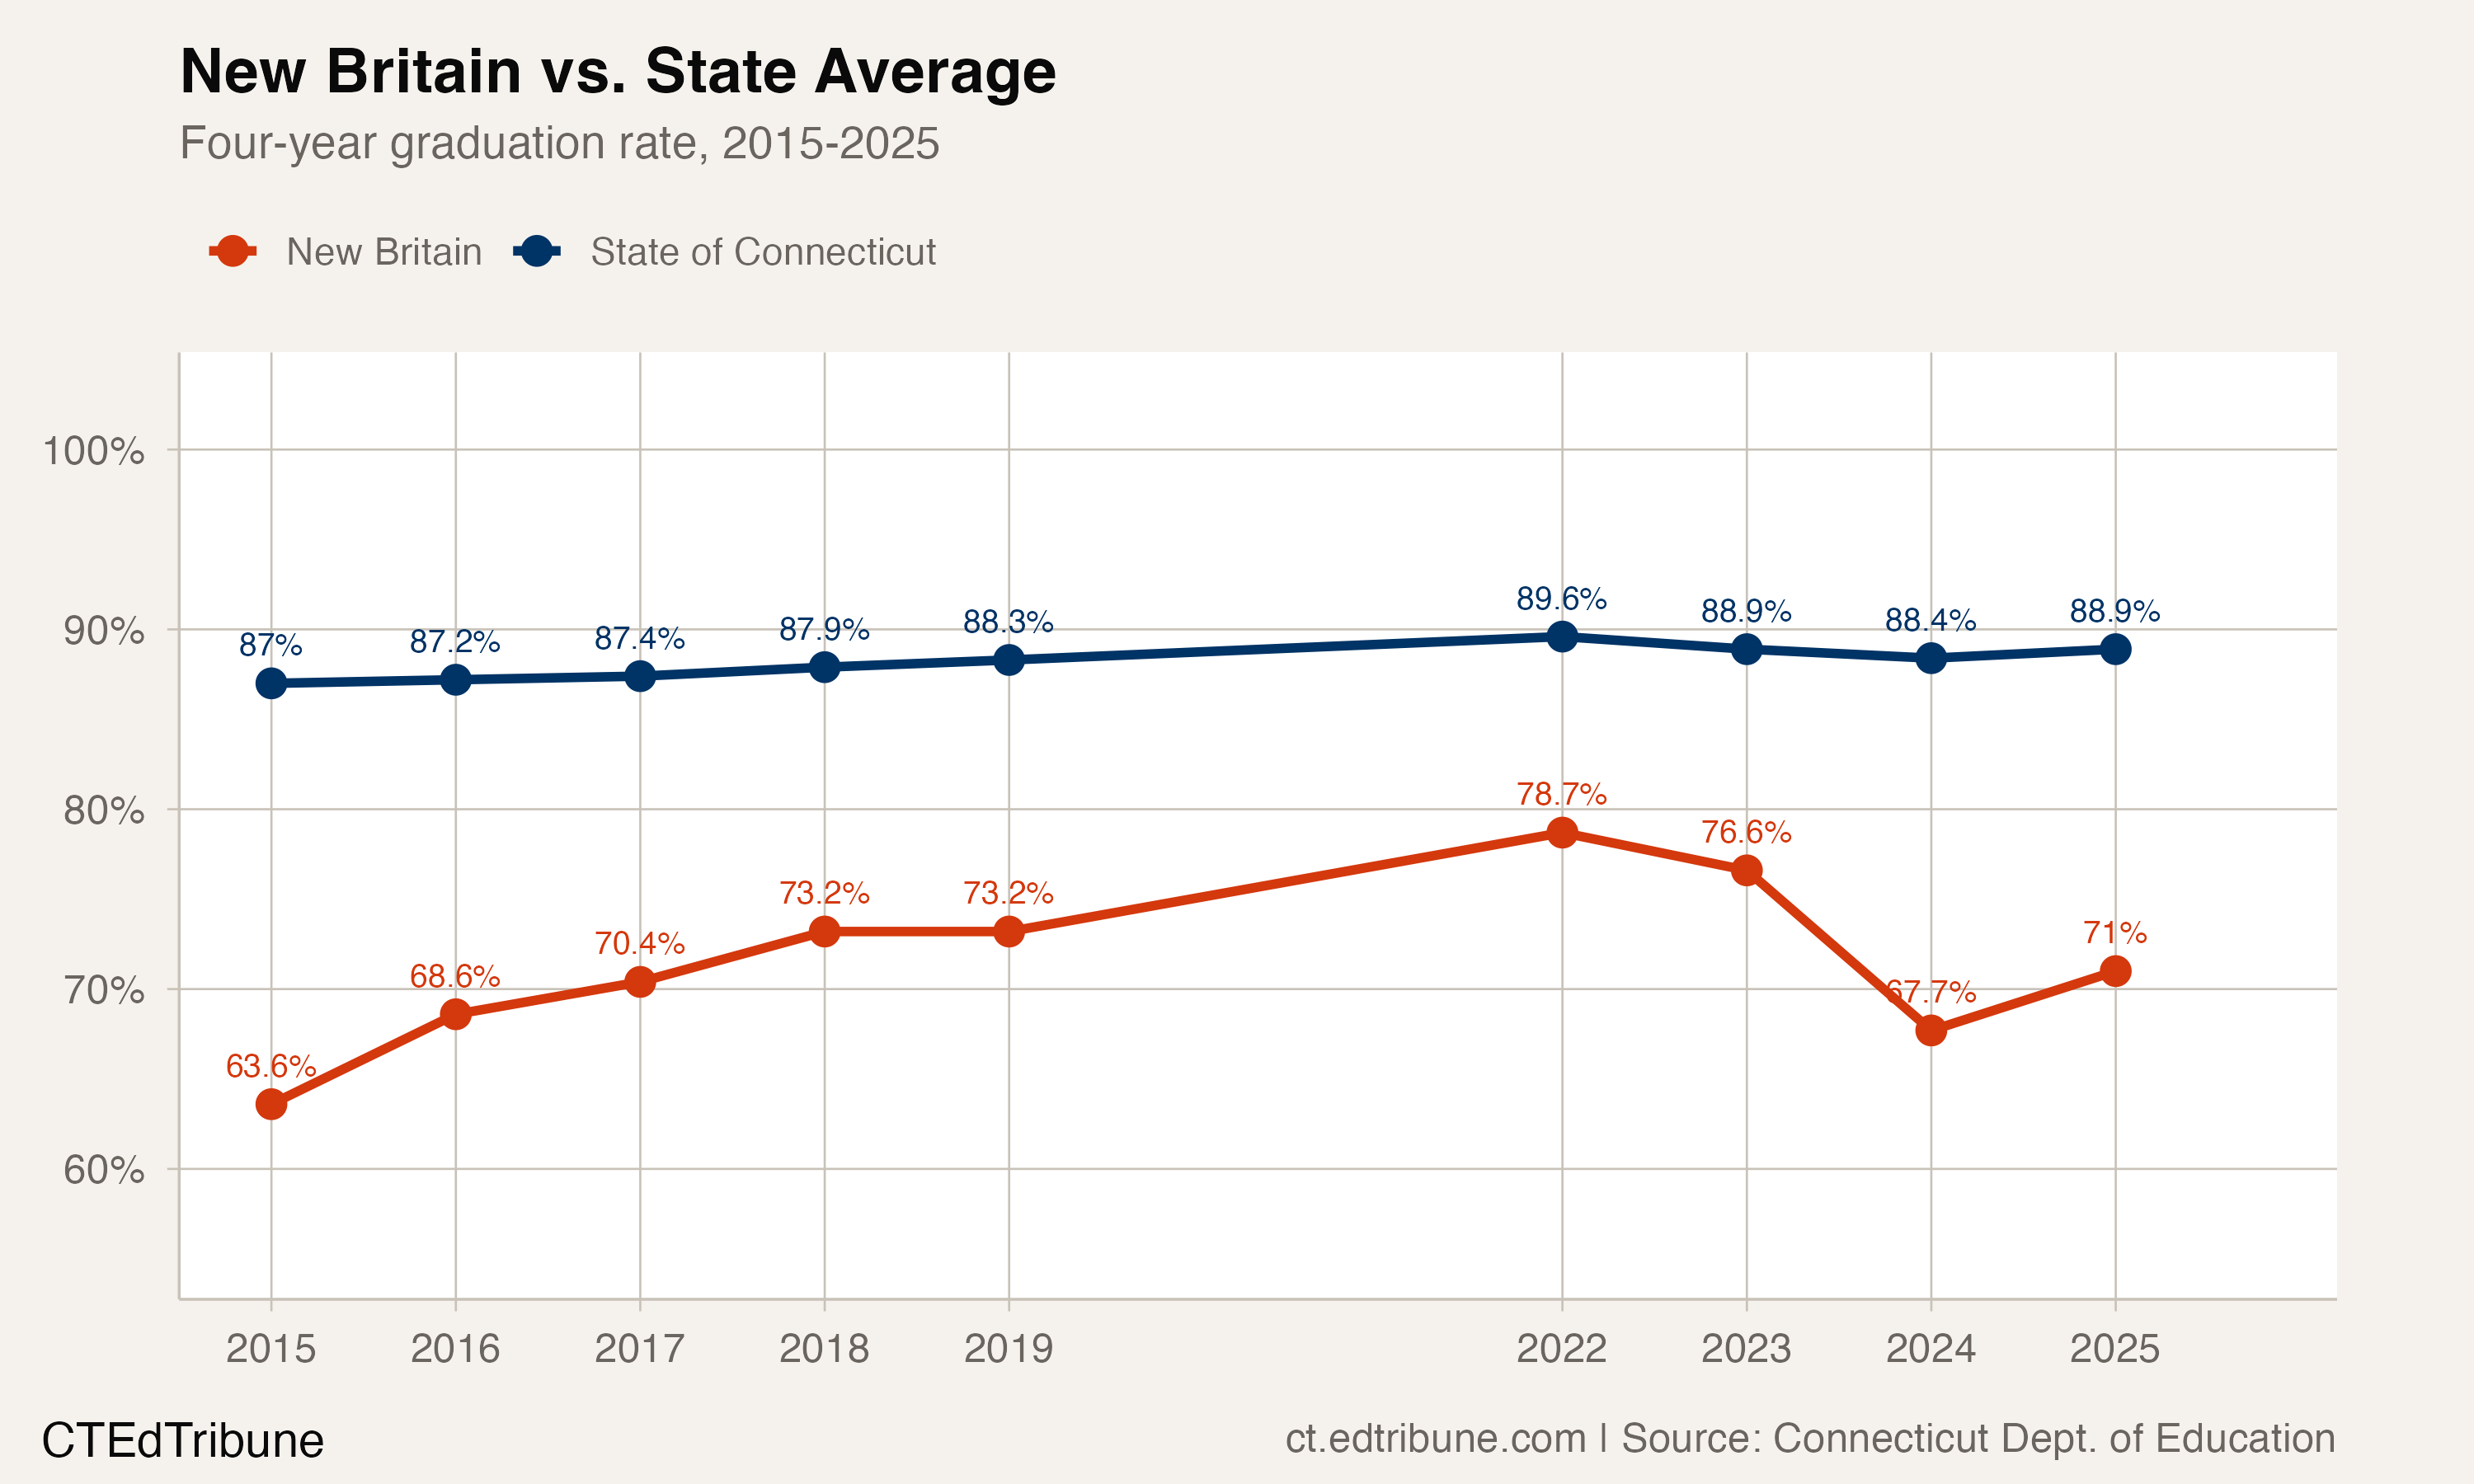
In 2022, New Britain↗ET graduated 78.7% of its students in four years, the highest rate in the available series.
Two years later, it graduated 67.7%, the lowest rate since 2015.
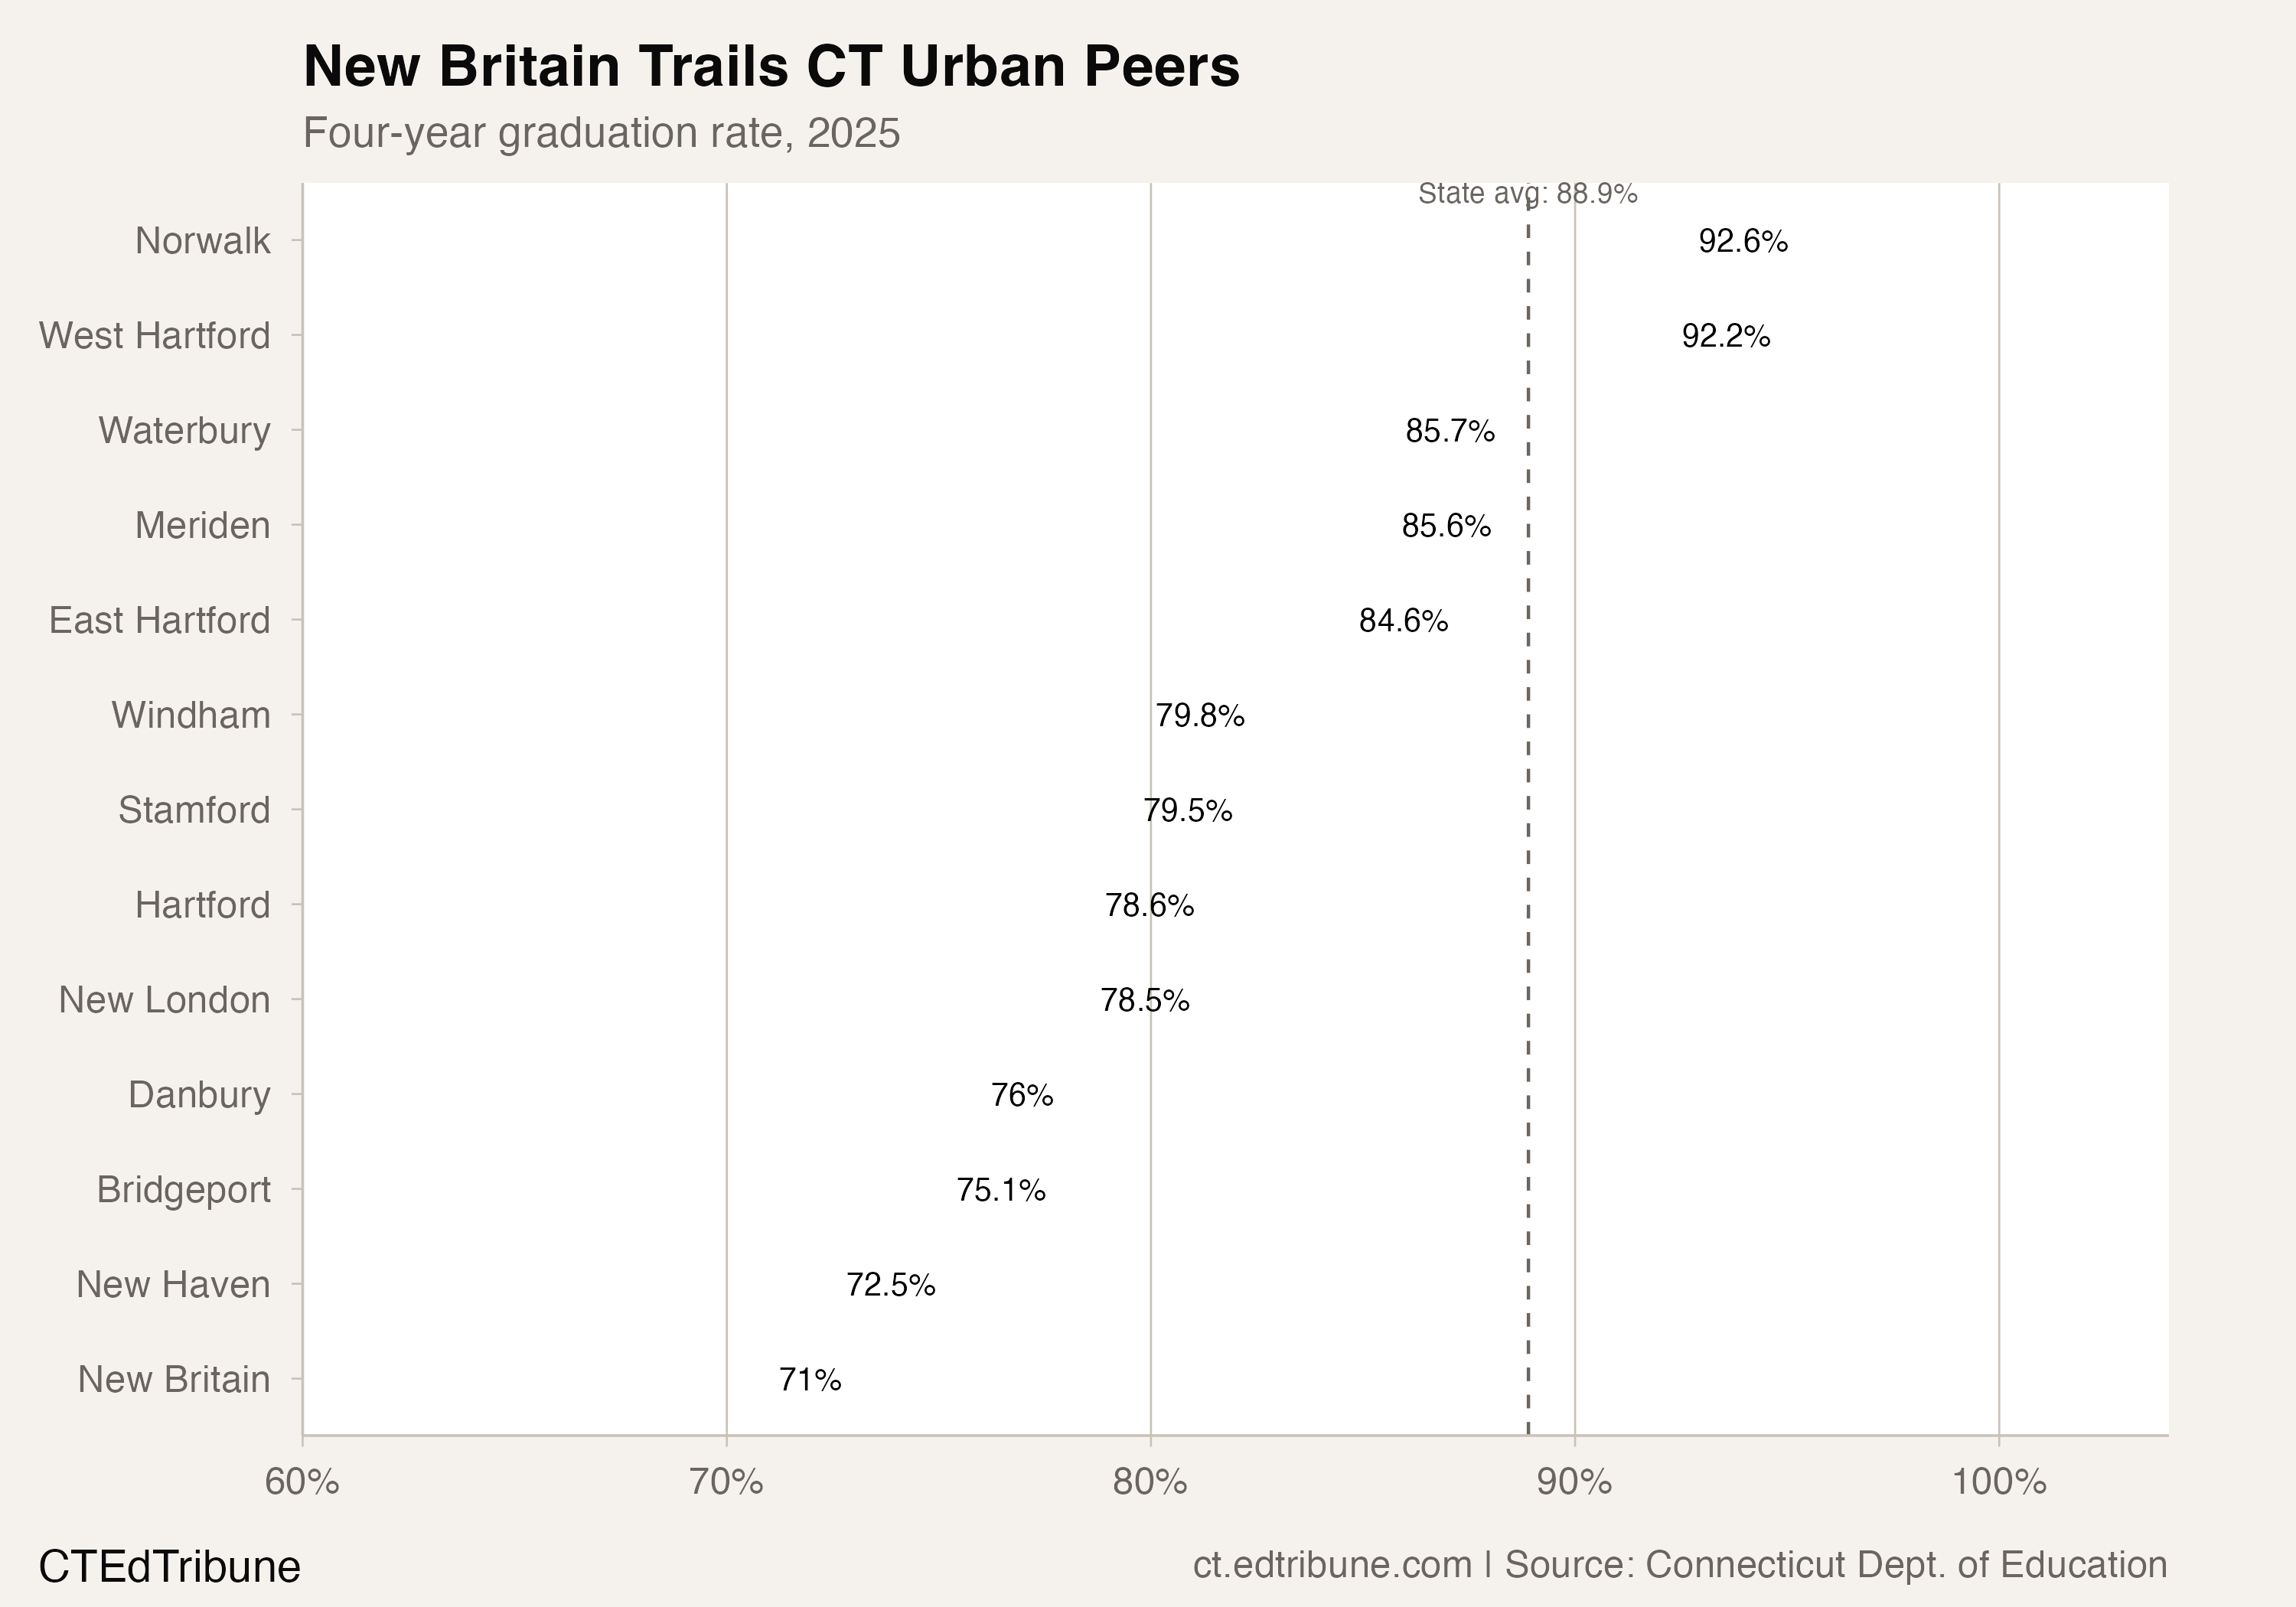
By 2025, the rate had partially recovered to 71.0%, but that was still enough to place New Britain last among the state's 102 traditional public school districts, 17.9 percentage points below the statewide average of 88.9%.
That is one story. Here is the other: New Britain's high-needs students, the group that includes anyone receiving special education, classified as an English learner, or eligible for free or reduced-price meals, graduated at 85.8% in 2025. That is 1.5 points below the state average for the same group. In 2015, the gap was 14.1 points.
A Climb That Collapsed
The trajectory from 2015 to 2022 looked like a turnaround in progress. New Britain's four-year graduation rate rose from 63.6% to 78.7%, a gain of 15.1 points over seven years. Each year brought improvement: 5.1 points in 2016, 1.8 in 2017, 2.8 in 2018. The district held steady through 2019, then posted another 5.4-point jump to its 2022 peak. That year, New Britain ranked 10th from the bottom among traditional districts instead of dead last.
Then the 2023 and 2024 cohorts arrived. The rate fell 2.1 points in 2023 and another 8.8 points in 2024, erasing most of a decade's progress in two graduating classes. The 2024 figure, 67.7%, was lower than any year since New Britain posted 63.6% in 2015.
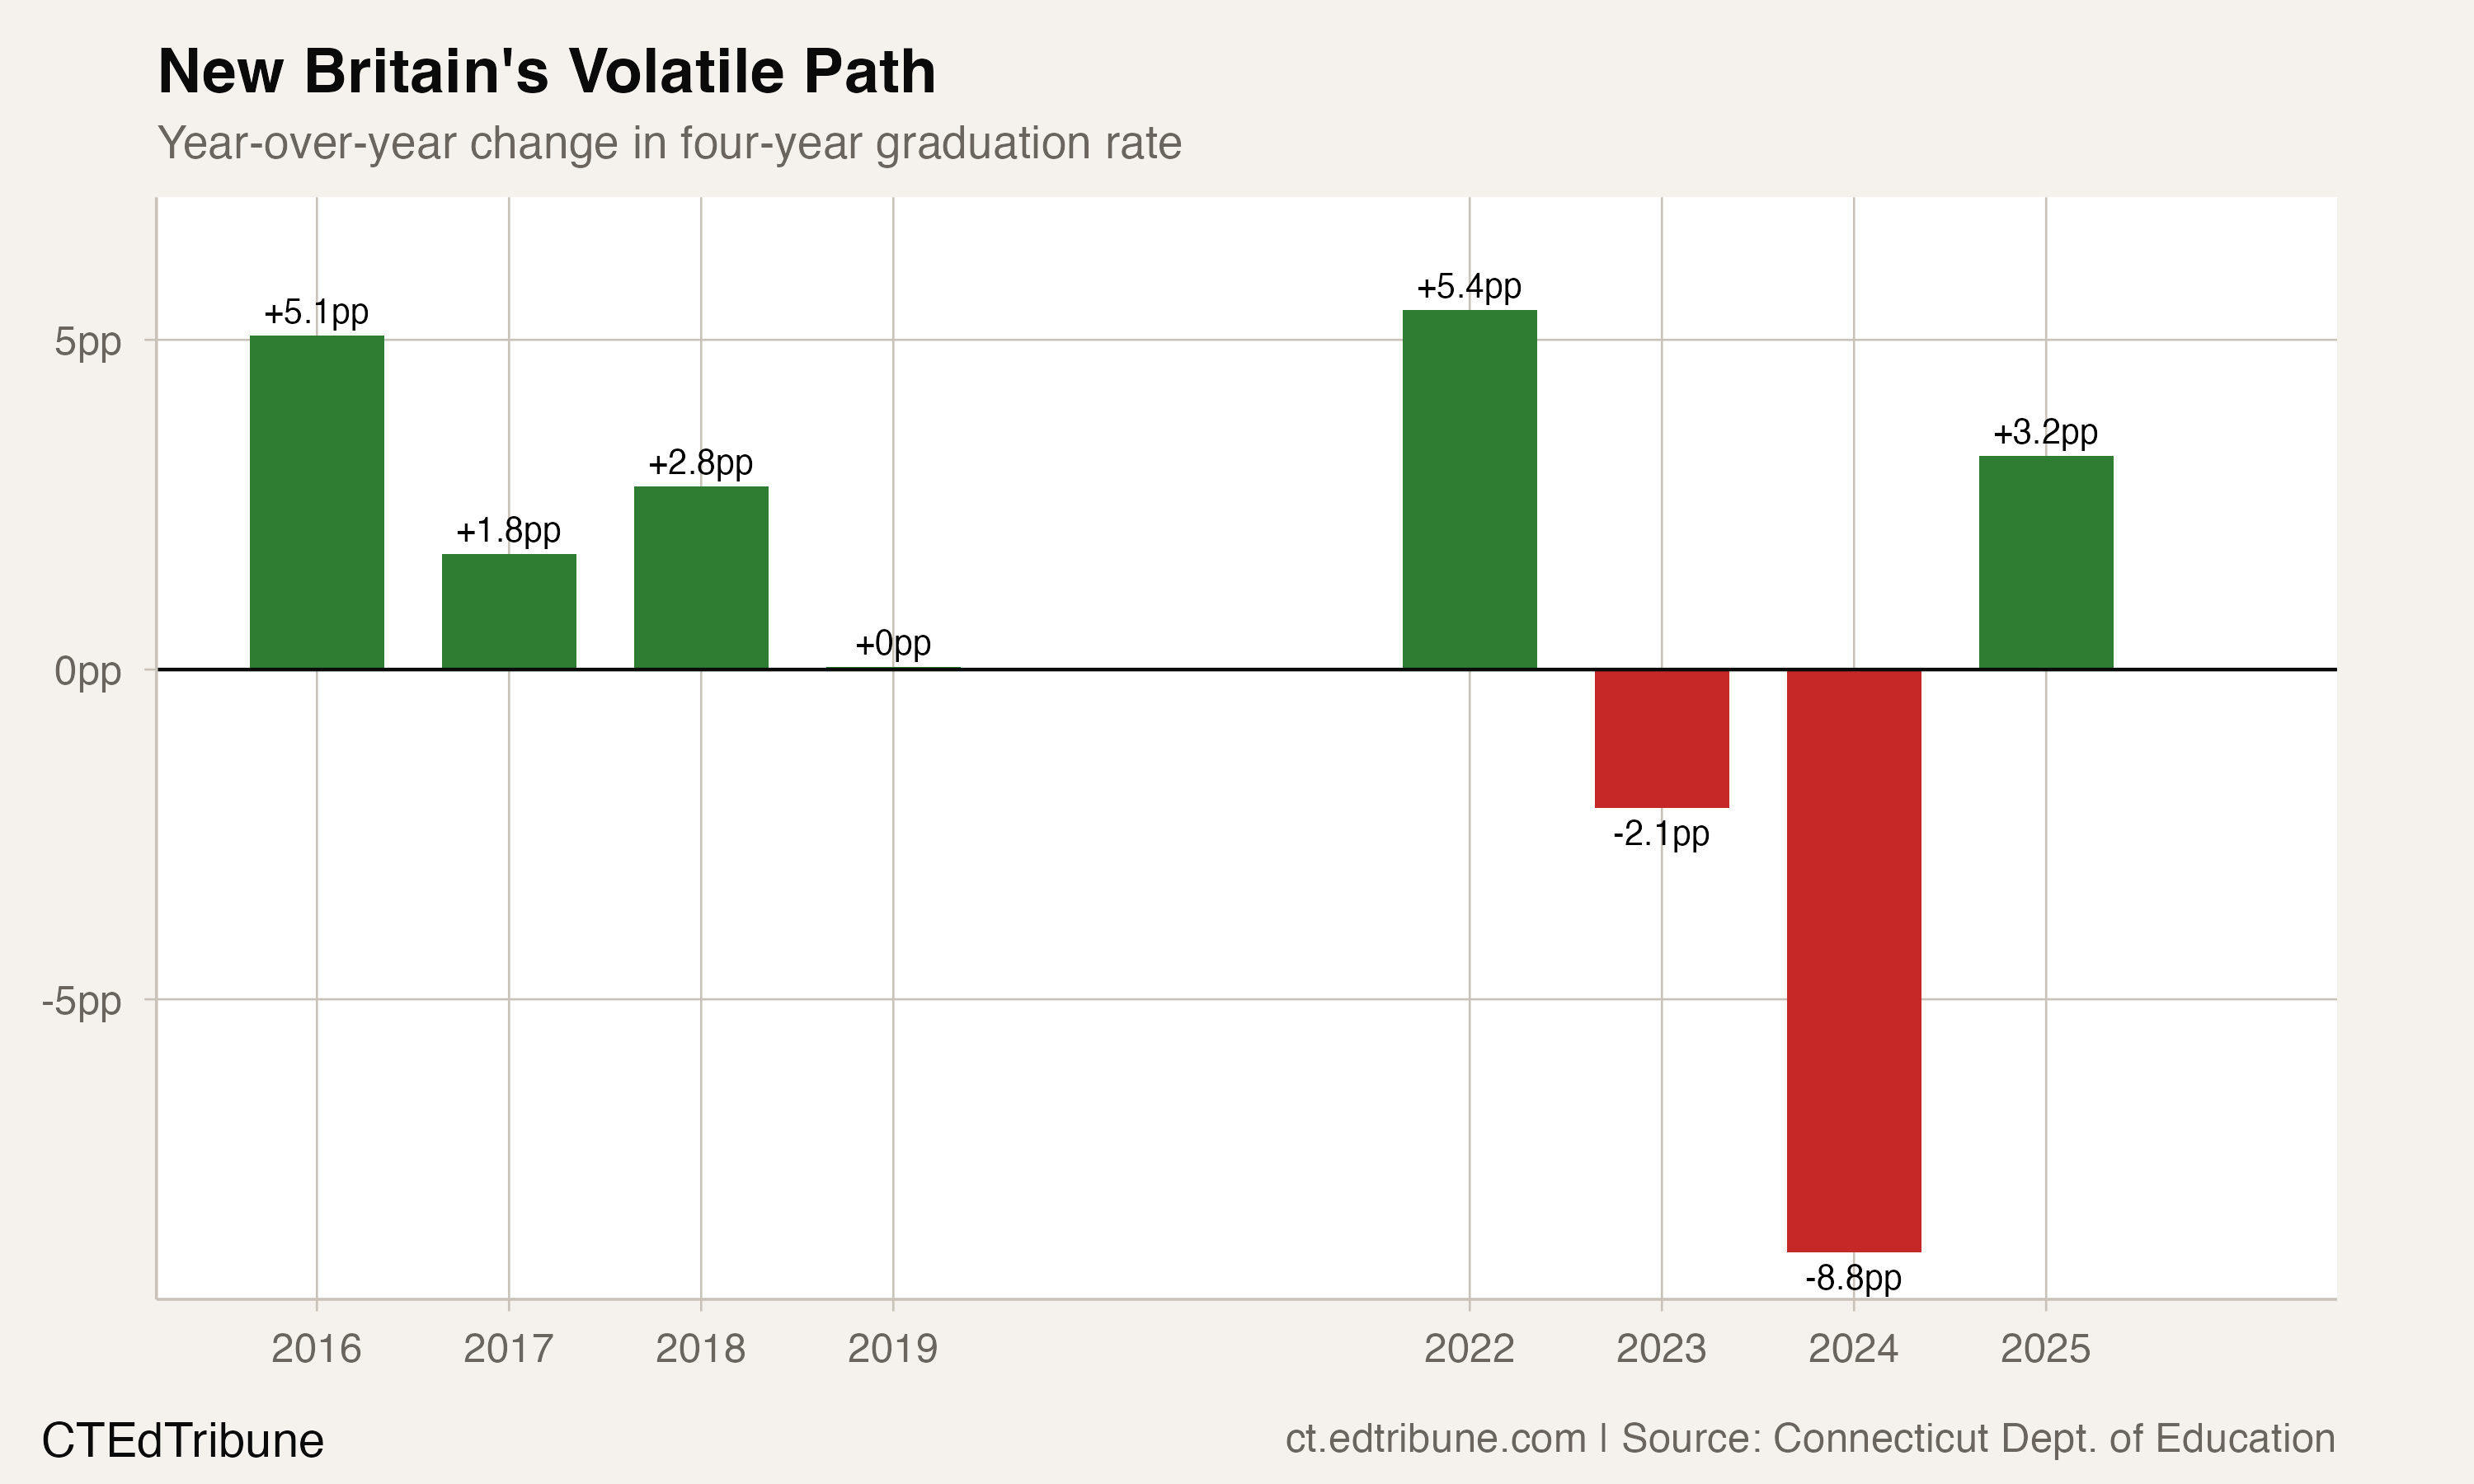
The 2025 cohort brought a partial rebound of 3.2 points. But 71.0% still leaves New Britain below New Haven↗ET (72.5%), Bridgeport↗ET (75.1%), and even Hartford↗ET (78.6%), a district that has historically shared the bottom of Connecticut's graduation rankings with New Britain.
The Paradox Inside the Numbers
The most striking finding is not New Britain's low ranking. It is what happened inside the district while the overall rate was falling.
In 2015, New Britain's high-needs students graduated at 63.5%, almost identical to the all-student rate of 63.6%. The two lines tracked together for two years. Then they diverged. By 2019, high-needs students graduated at 77.3%, four points above the all-student rate of 73.2%. By 2025, the gap had widened to 14.8 points: high-needs students at 85.8%, all students at 71.0%.
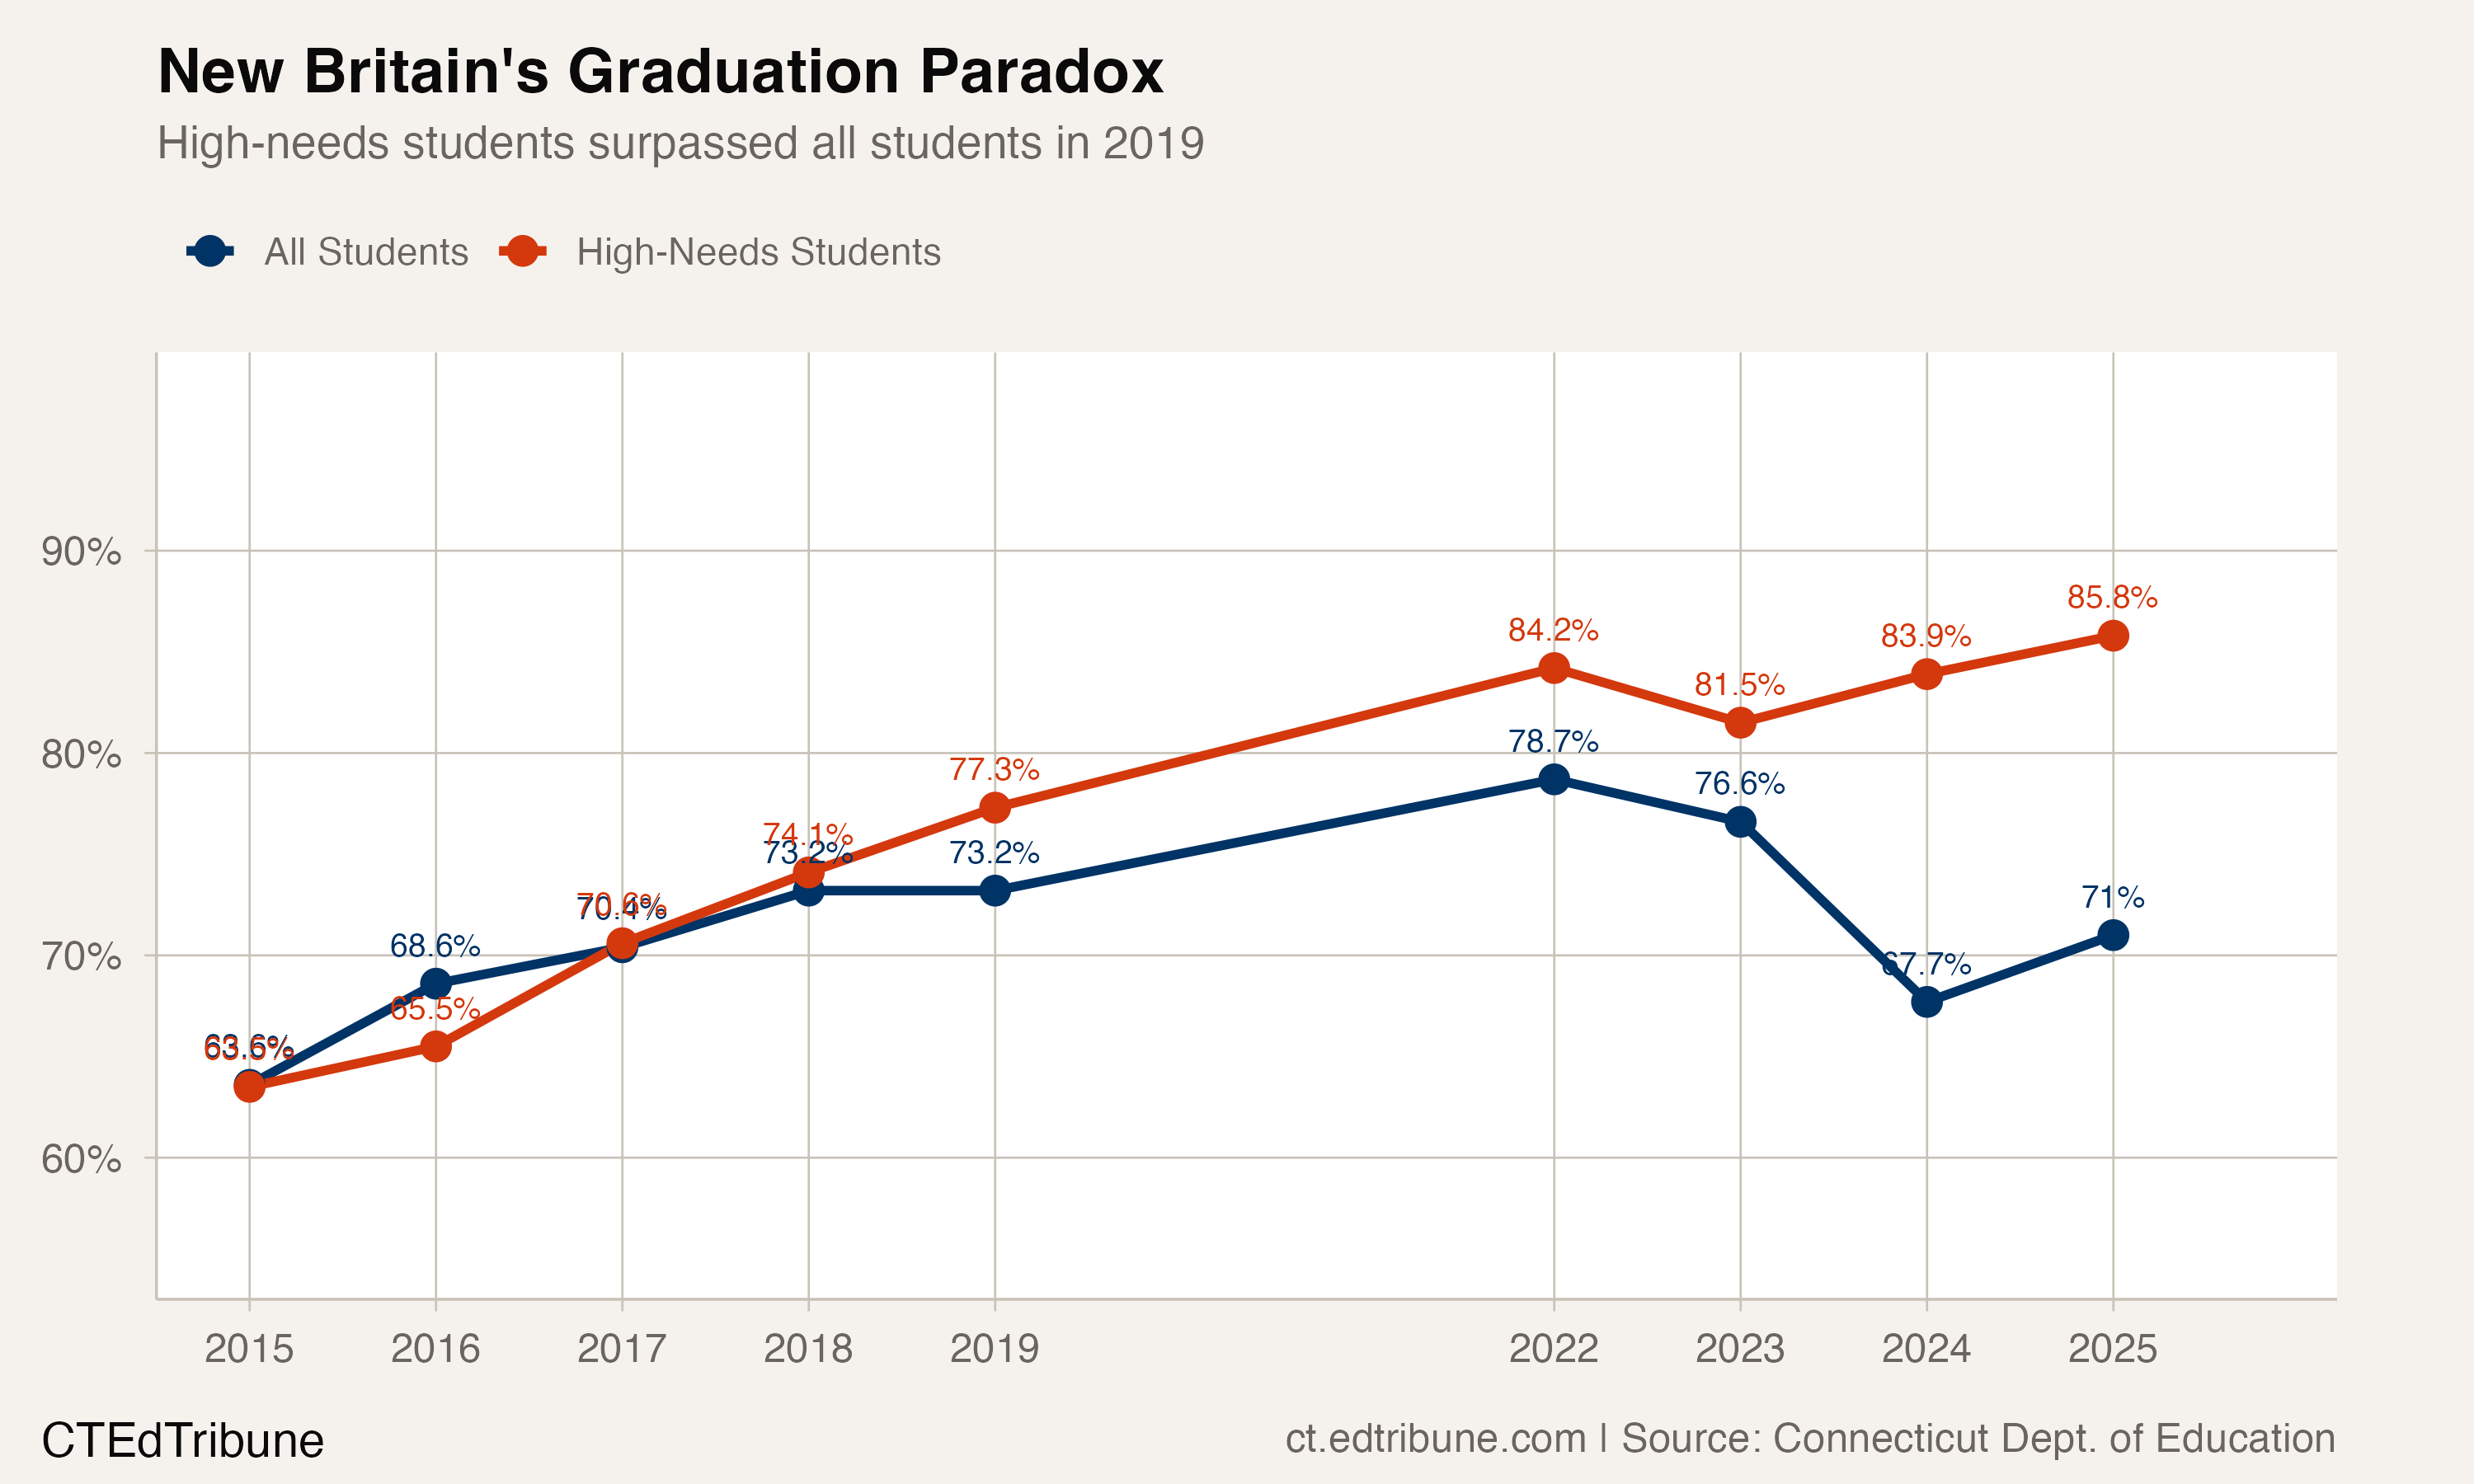
That 22.3-point improvement for high-needs students over a decade ranks third among all traditional districts in Connecticut, behind only Waterbury↗ET (24.9 points) and Ellington (22.7 points). And while the overall rate crashed in 2024, the high-needs rate barely flinched, dipping from 84.2% in 2022 to 81.5% in 2023 before climbing back to 83.9% in 2024 and 85.8% in 2025.
How does a district's targeted student population improve steadily while its overall rate collapses? One unresourced possibility is compositional: if the share of students classified as high-needs grew substantially, the "non-high-needs" group shrank and became more volatile. Connecticut's high-needs designation encompasses free or reduced-price lunch eligibility, special education, and English learner status. The graduation data used here do not test that explanation.
The Waterbury Contrast
The most instructive comparison is Waterbury. In 2015, Waterbury graduated 67.9% of students, just 4.3 points ahead of New Britain.
By 2025, Waterbury had reached 85.7%. New Britain was at 71.0%. The gap between the two had grown from 4.3 points to 14.7 points.
Waterbury's trajectory was smoother. It gained ground in every period: 69.2% in 2016, 76.7% in 2019, 83.6% in 2022, 85.7% in 2025. It never posted a year-over-year decline larger than 2.3 points. New Britain's 8.8-point drop in 2024 has no equivalent in Waterbury's record.
What Budget Pressures Look Like on the Ground
New Britain's fiscal situation compounds the graduation challenge. In 2024, the district proposed a $133.3 million budget while absorbing the loss of 86 staff positions after federal ESSER pandemic relief funding expired. Superintendent Anthony Gasper described the proposal as containing "nothing that is a wish list," but the city's Board of Finance reduced the requested increase to $500,000.
The Connecticut Association of Boards of Education has highlighted the district's attendance initiatives, including 10-day attendance reporting cycles and school-level attendance teams that reduced chronic absenteeism in early grades by 6 to 17 percentage points between 2012 and 2014. Whether those elementary-level gains translated into improved graduation rates for the cohorts now reaching 12th grade is an open question. That connection is suggestive context, not direct evidence.
The Gap New Britain Closed, and the One It Did Not
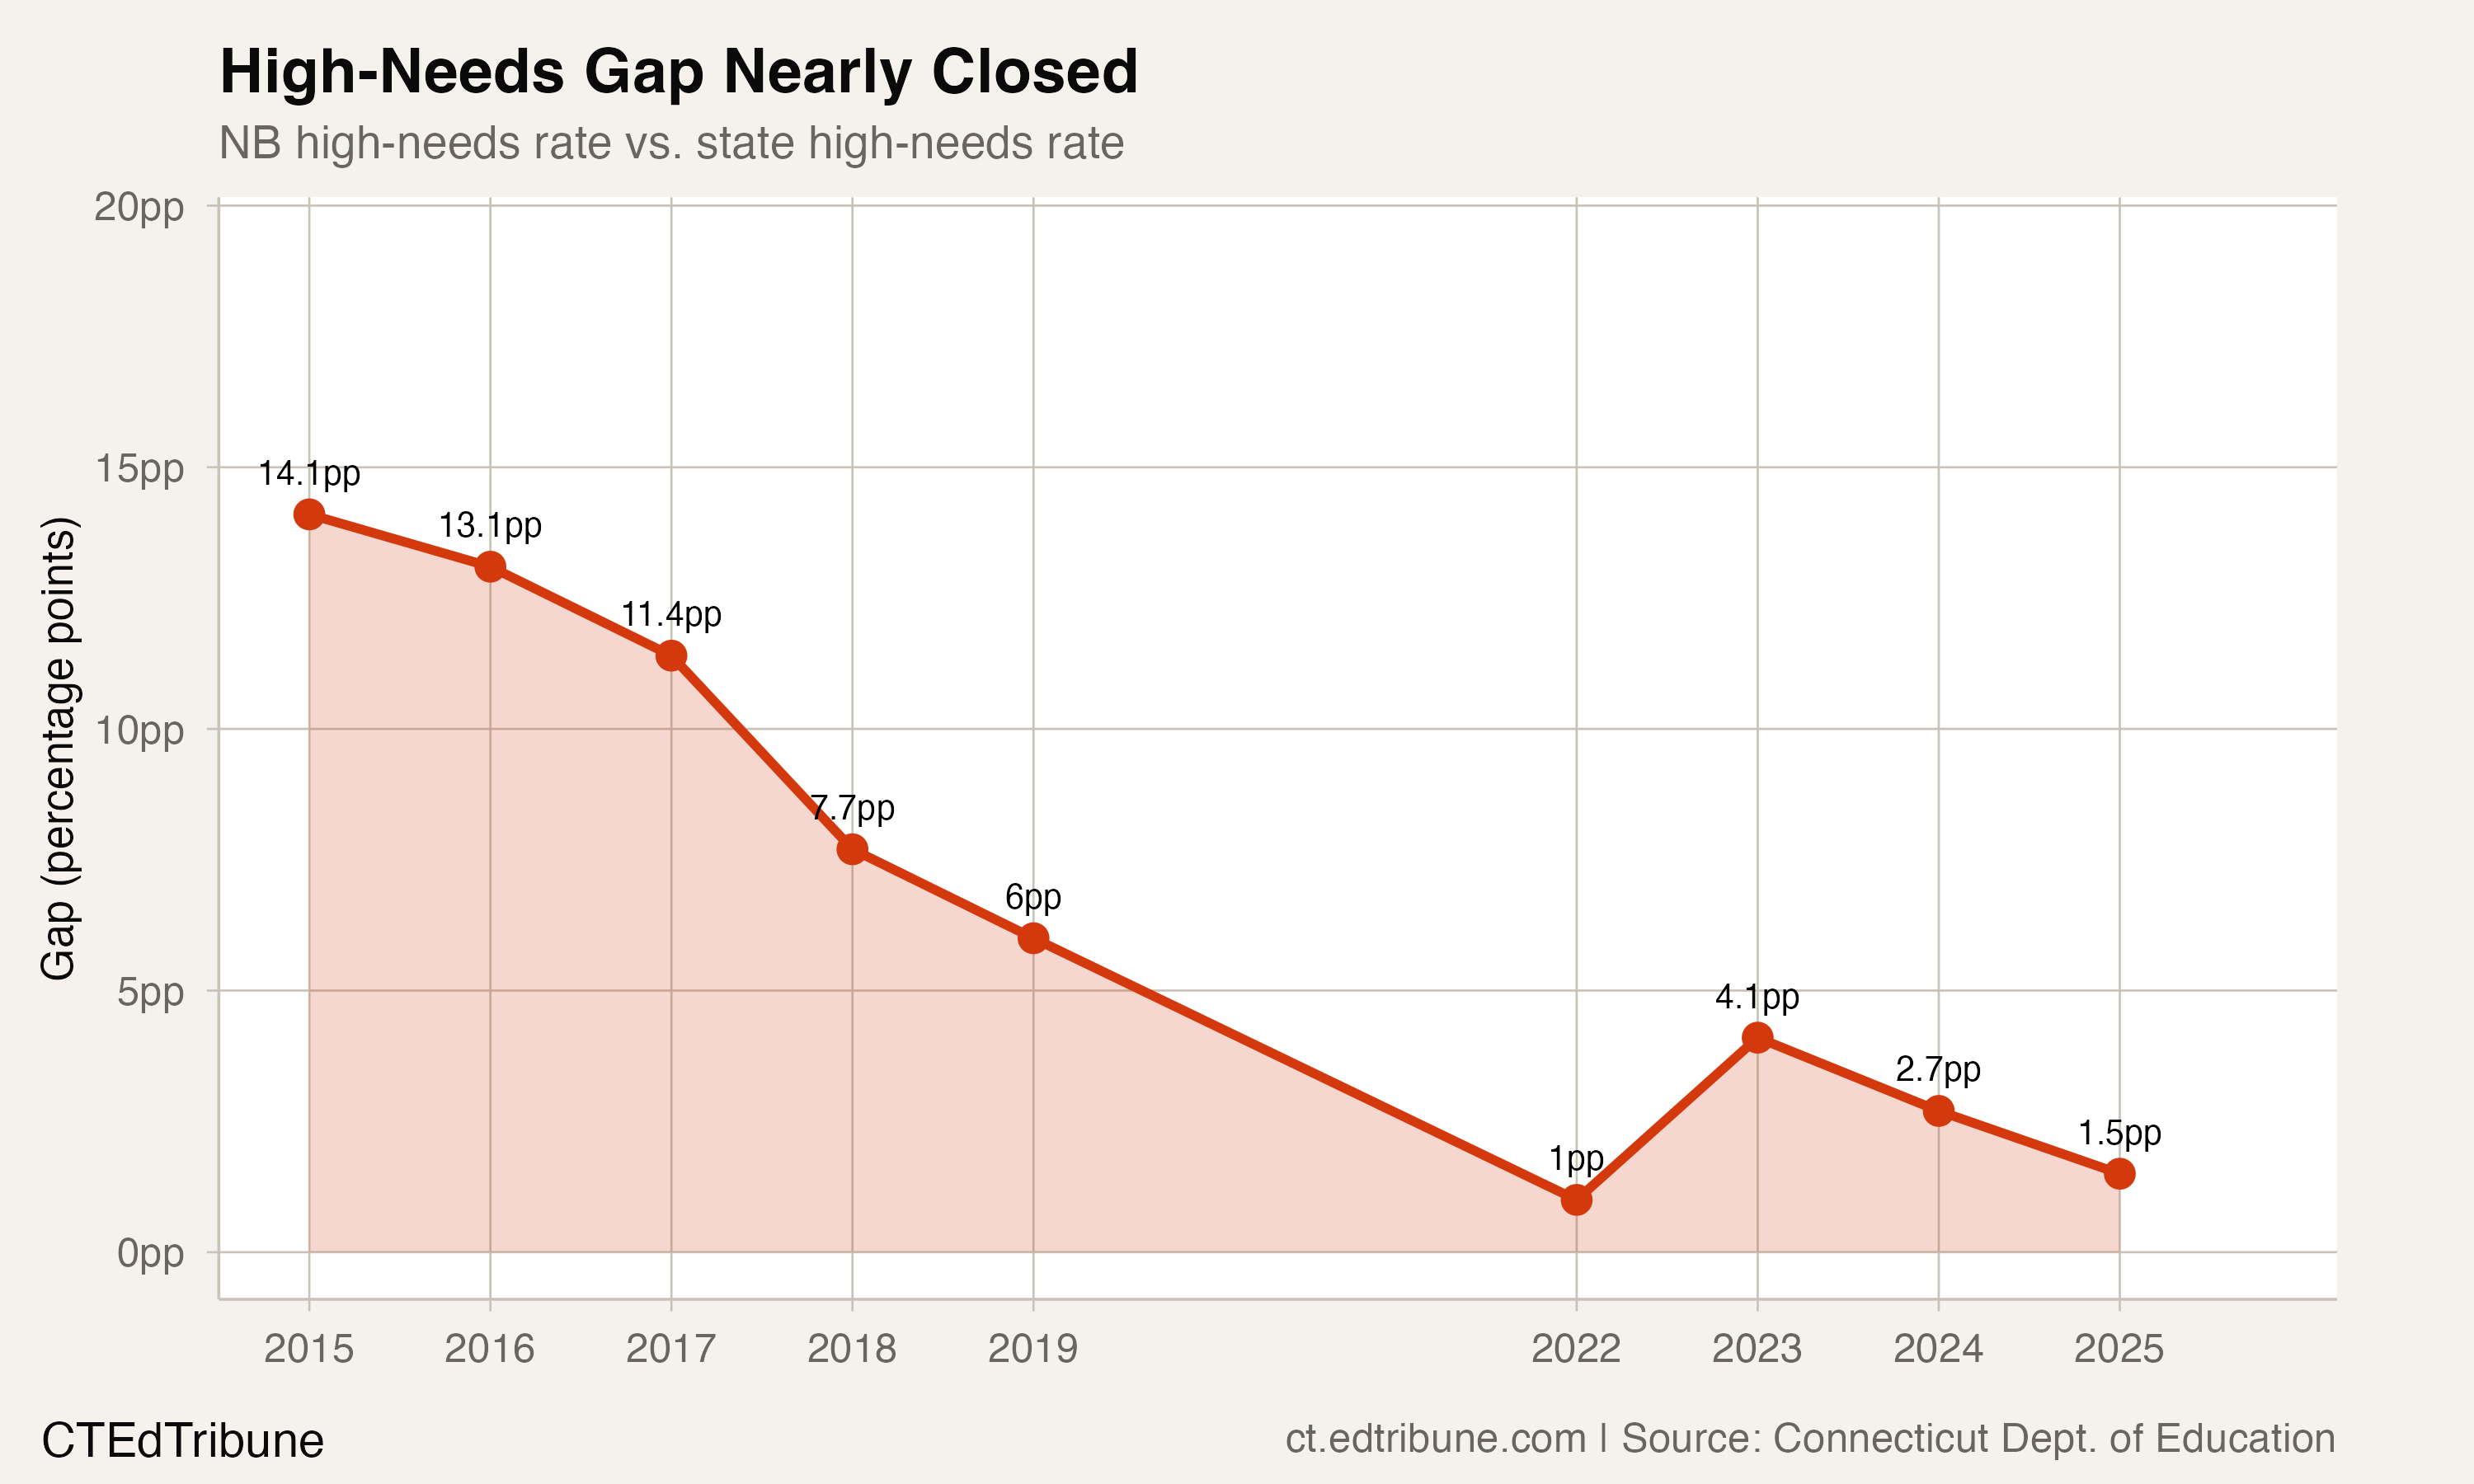
The gap between New Britain's high-needs graduation rate and the state's high-needs rate shrank from 14.1 points in 2015 to 1.0 points in 2022. It widened slightly in 2023, then narrowed again to 1.5 points by 2025. That convergence is real and substantial.
The gap New Britain did not close is the one between its overall rate and the state's overall rate. That stood at 23.4 points in 2015, narrowed to 10.9 points in 2022, then widened back to 17.9 points by 2025. The question is whether the 2024 collapse was an aberration, a single bad cohort that the 2025 rebound is already correcting, or the beginning of a new pattern.
The next graduation release will add evidence about whether New Britain's earlier progress was durable or whether the gains that took seven years to build can be undone in two.
Detailed code that reproduces the analysis and figures in this article is available exclusively to EdTribune subscribers.
Discussion
Sign in to join the discussion.
Loading comments...