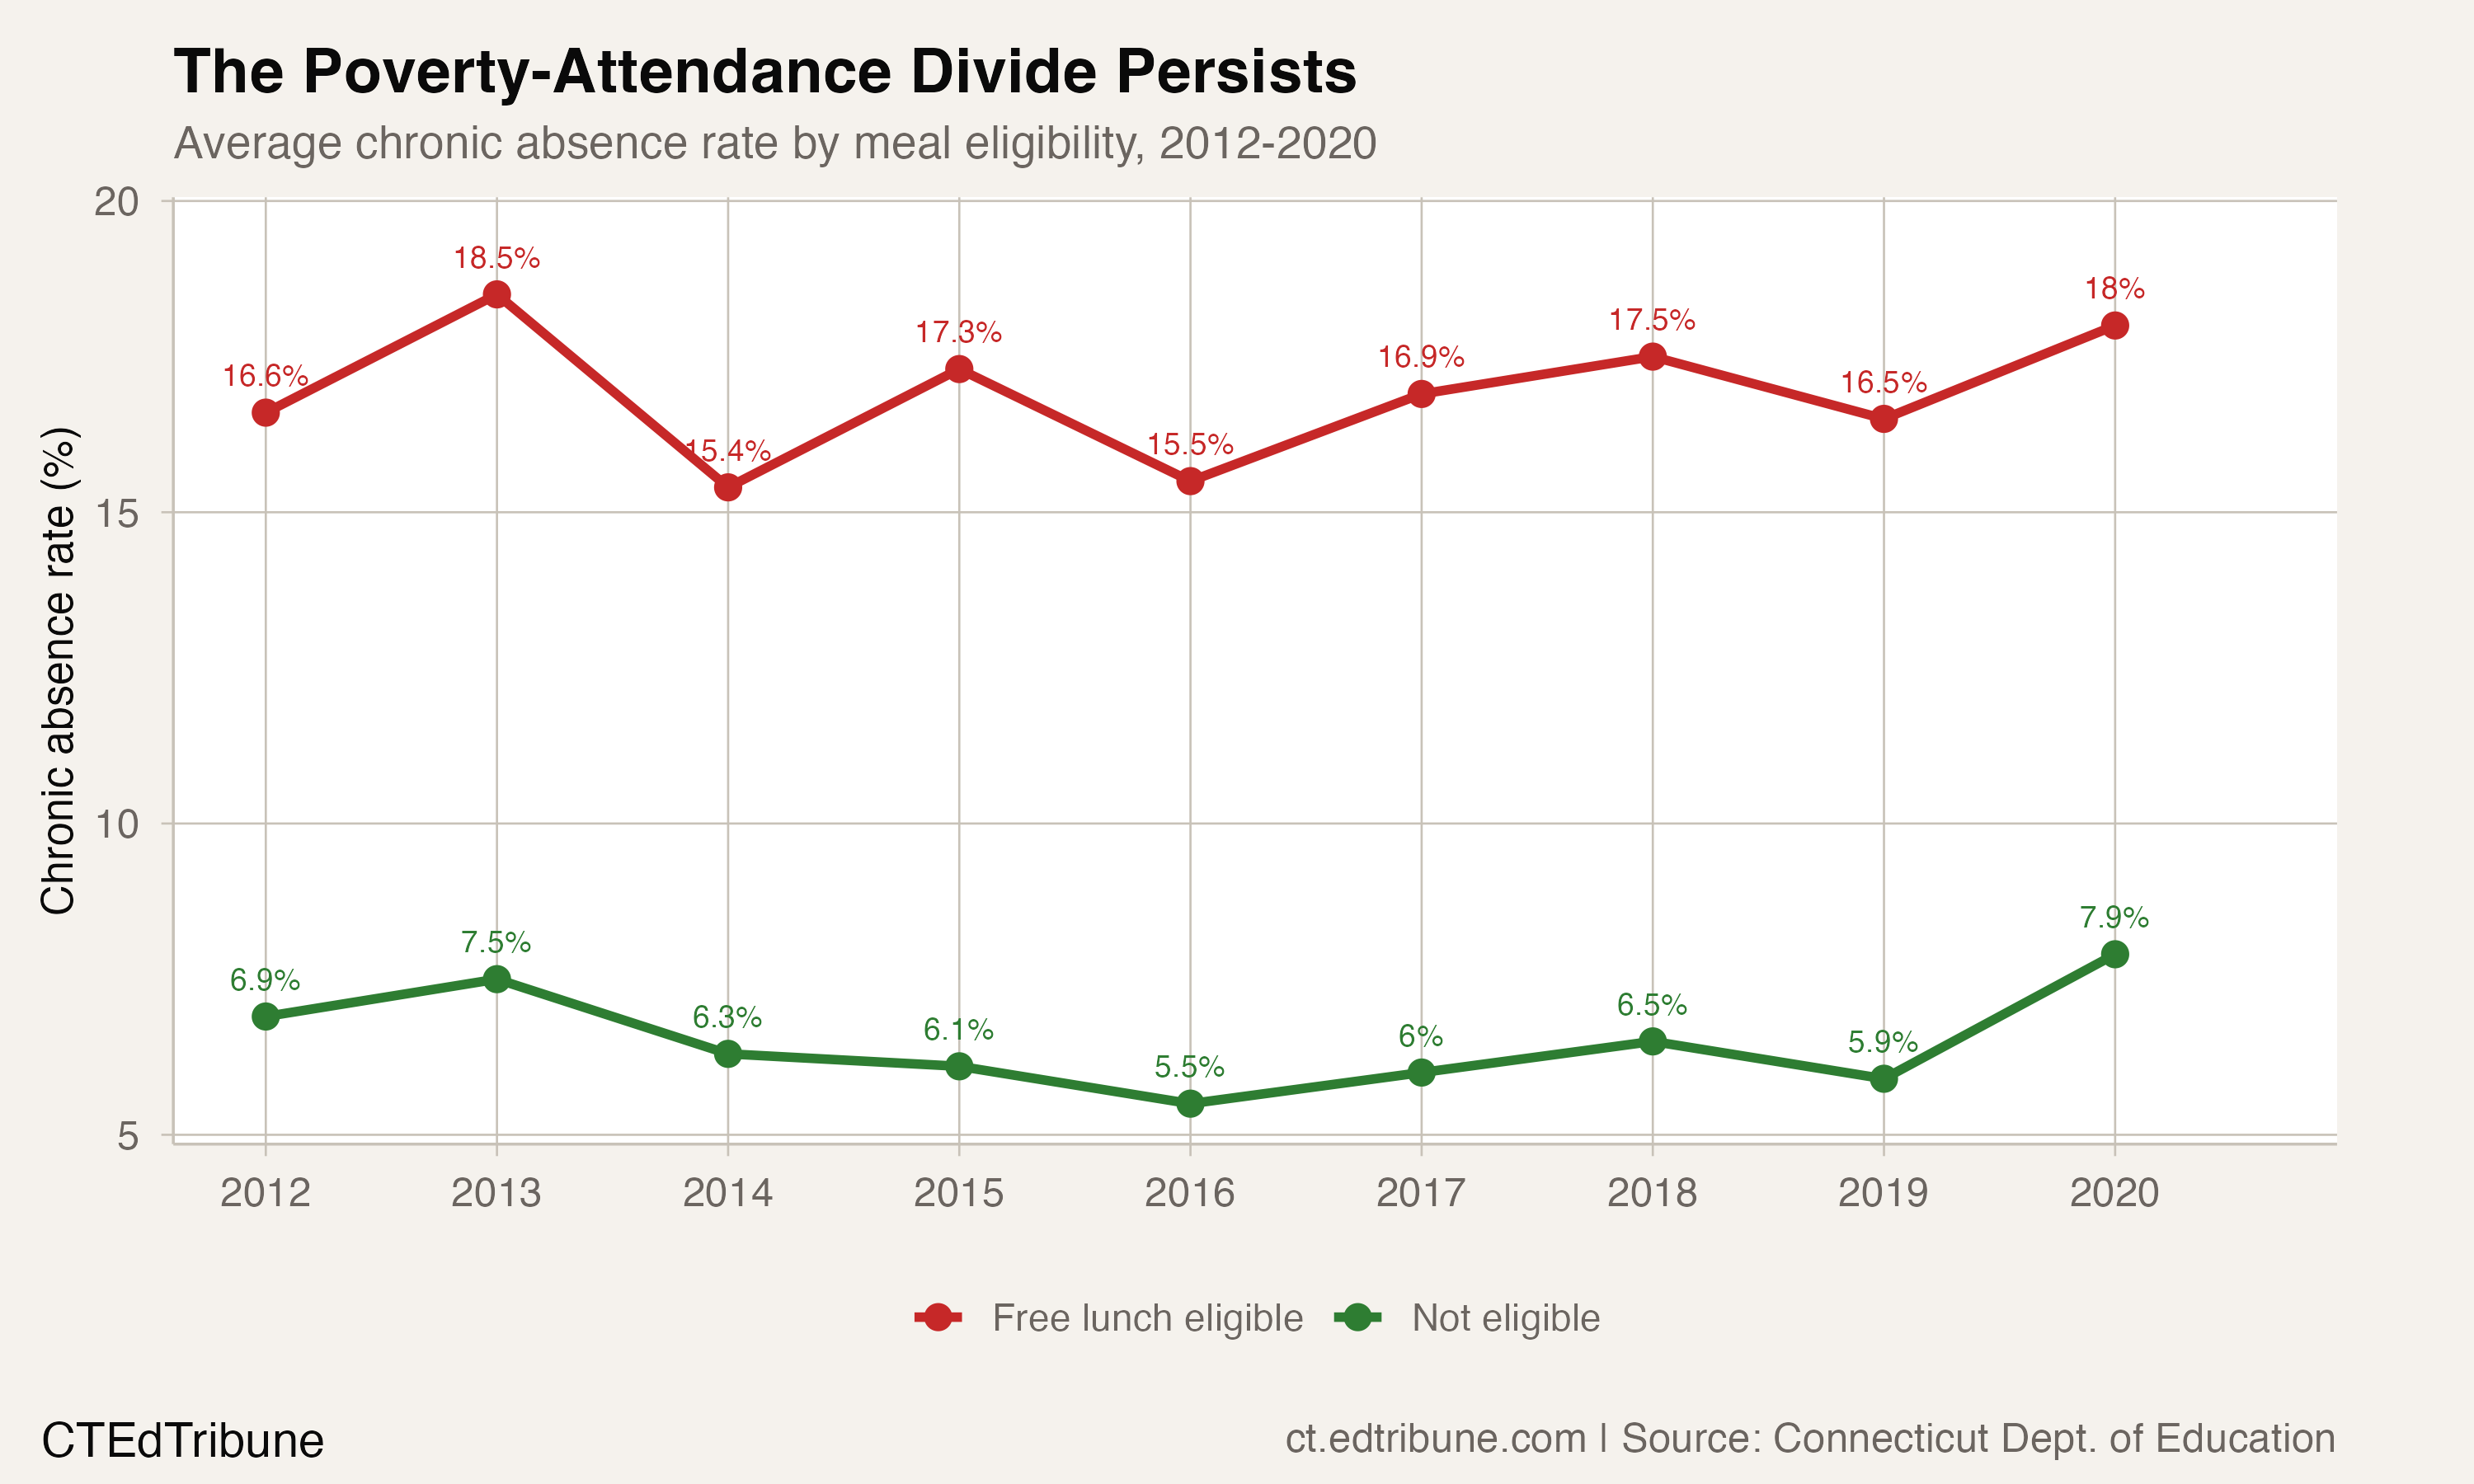
Across the 130 Connecticut districts that reported meal eligibility breakdowns in 2020, students eligible for free lunch had an average chronic absenteeism rate of 18.0%. Their peers who were not eligible for subsidized meals: 7.9%.
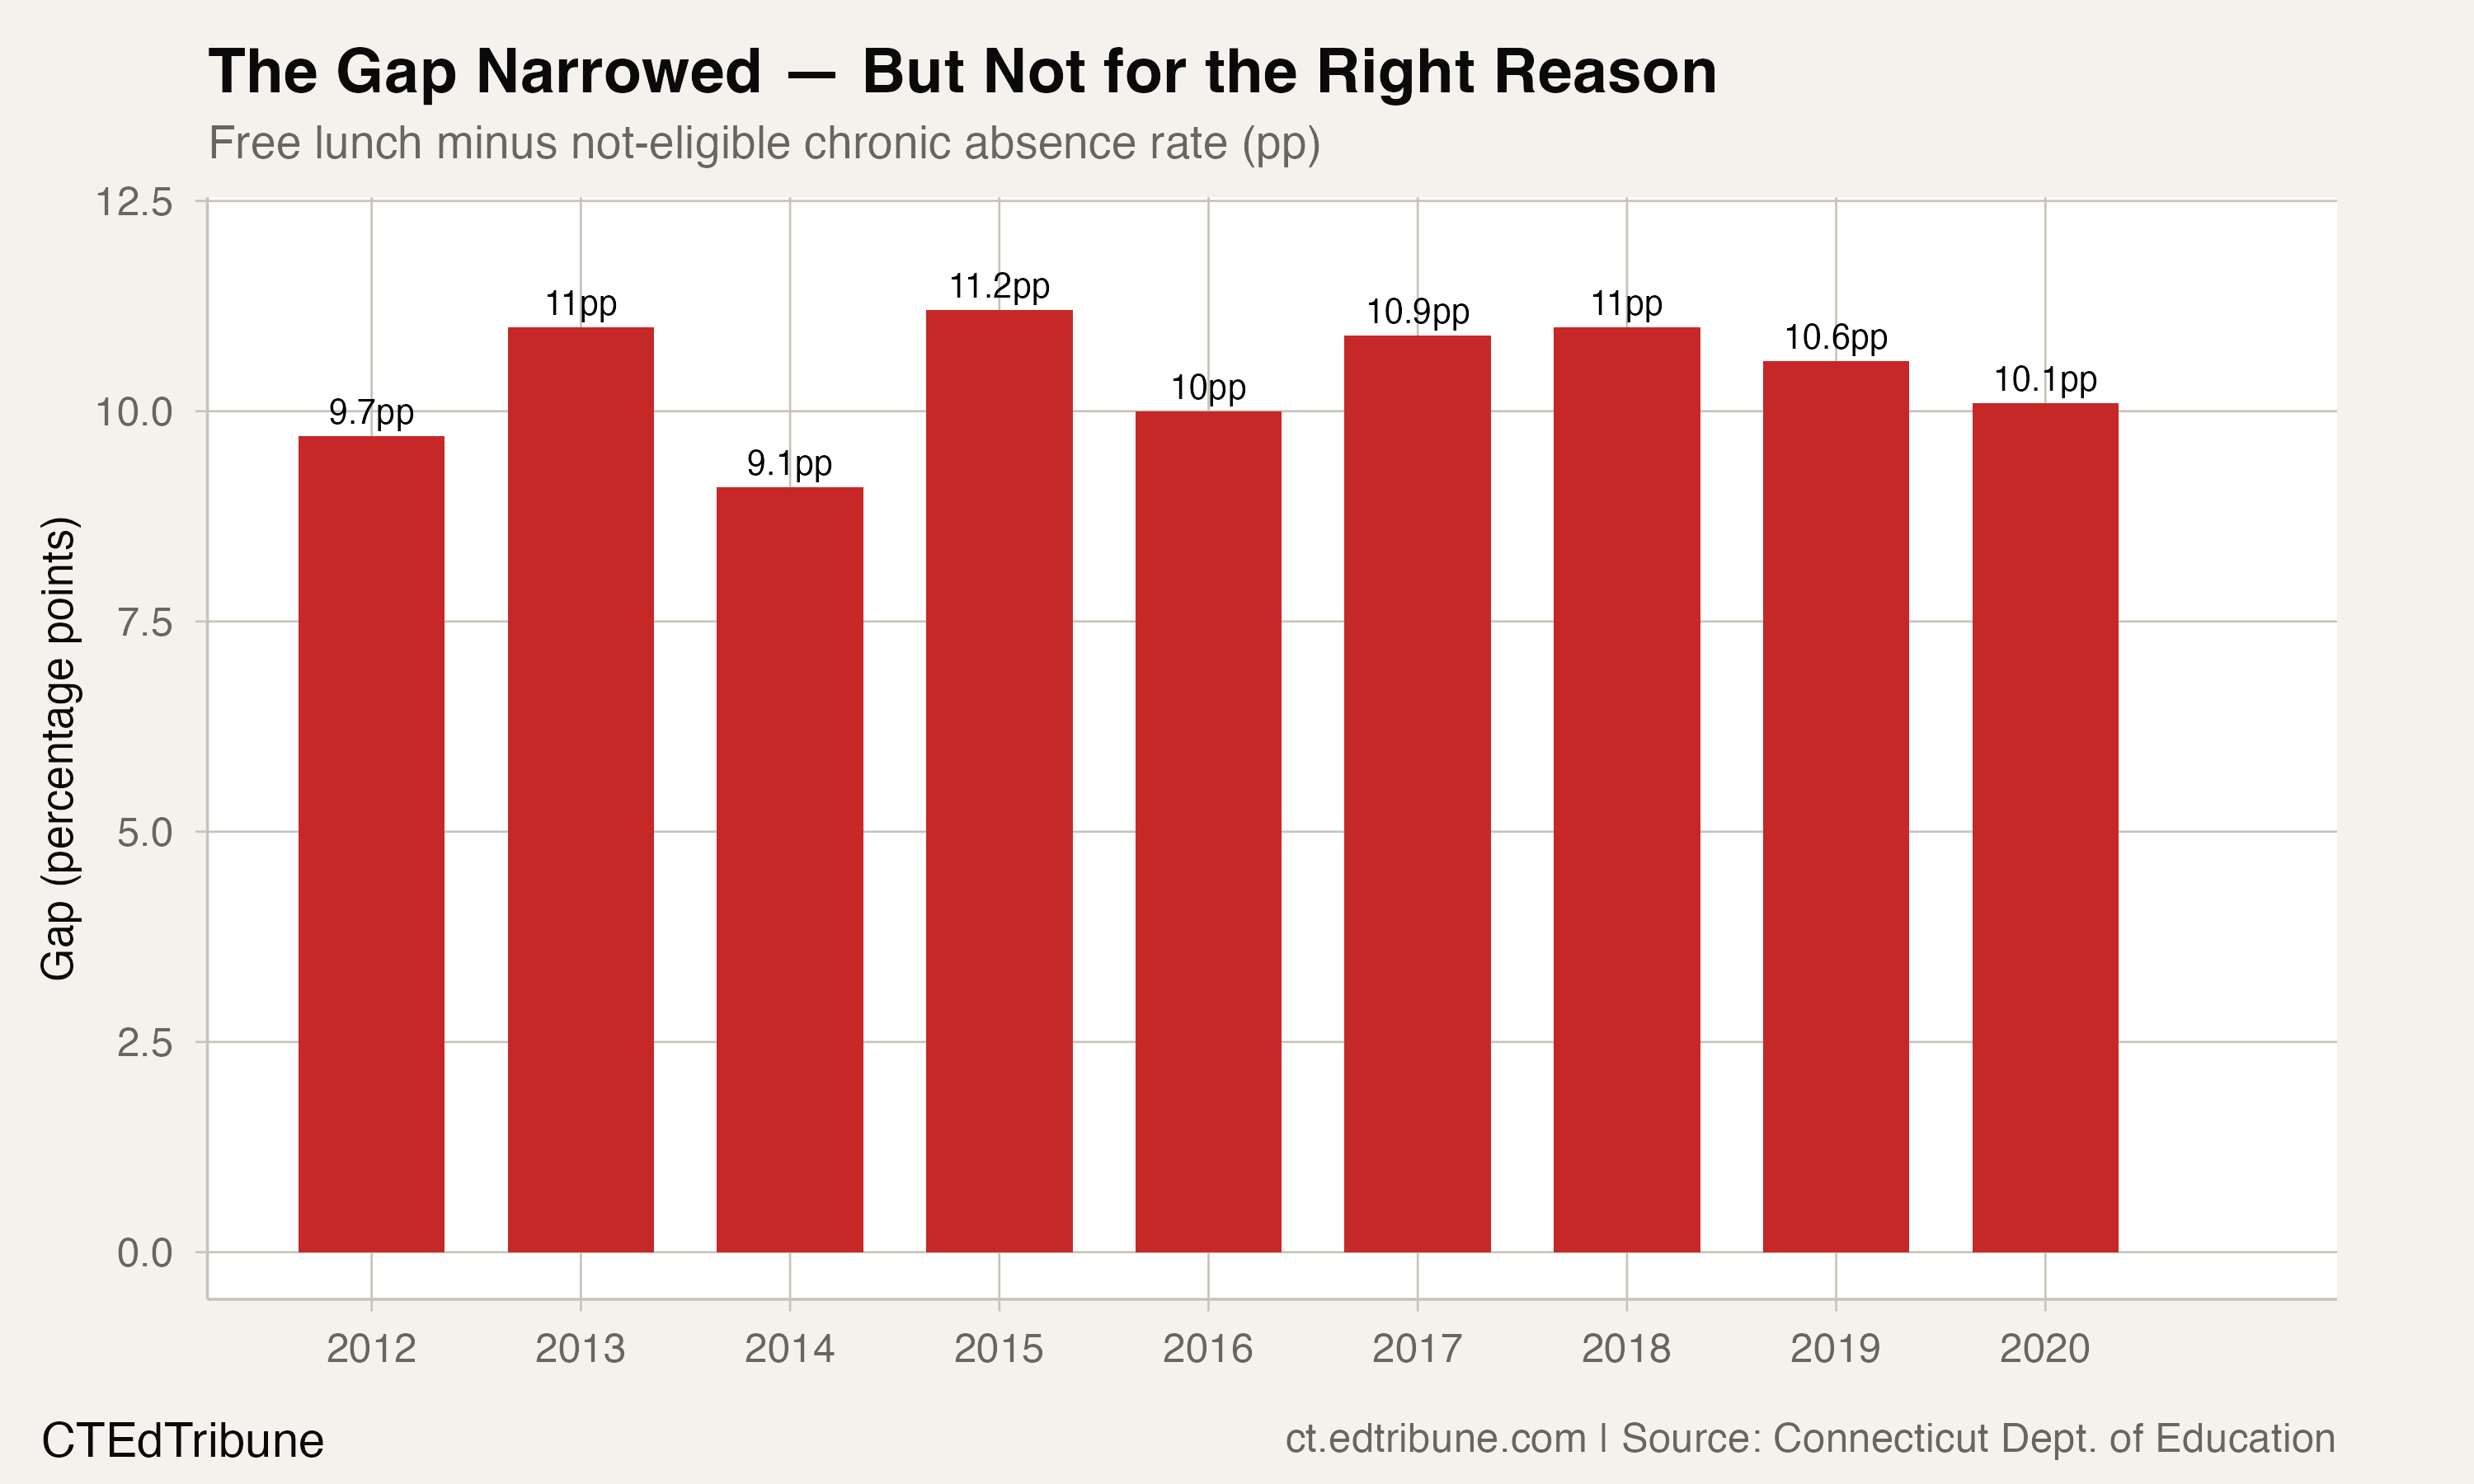
The 10.1 percentage-point gap means that students from low-income families were missing school at more than twice the rate of their wealthier classmates. And while the gap narrowed slightly over nine years — from 9.7 points in 2012 — it did so for the wrong reason.
The gap narrowed because the better-off got worse
In 2012, non-eligible students averaged a 6.9% chronic absence rate. By 2020, that figure had risen to 7.9% — a 1.0 percentage-point increase. Over the same period, free-lunch-eligible students went from 16.6% to 18.0%, a 1.4-point increase.
Both groups worsened. But the non-eligible group worsened proportionally more — a 14.5% increase from their 2012 baseline, compared to an 8.4% increase for the free-lunch group. The gap appeared to narrow because the denominator — the more affluent group — deteriorated faster than the numerator.
This is not convergence. Convergence would mean free-lunch students improving while non-eligible students held steady, or both improving with the lower group gaining faster. What happened in Connecticut is both groups moving in the wrong direction, with the wealthier group losing ground more quickly.
A clear income gradient
The data reveals a three-tier gradient when reduced-price lunch students are included. In 2020, the average chronic absence rate by meal eligibility was:
- Free lunch eligible: 18.0%
- Reduced-price lunch eligible: 10.9%
- Not eligible: 7.9%
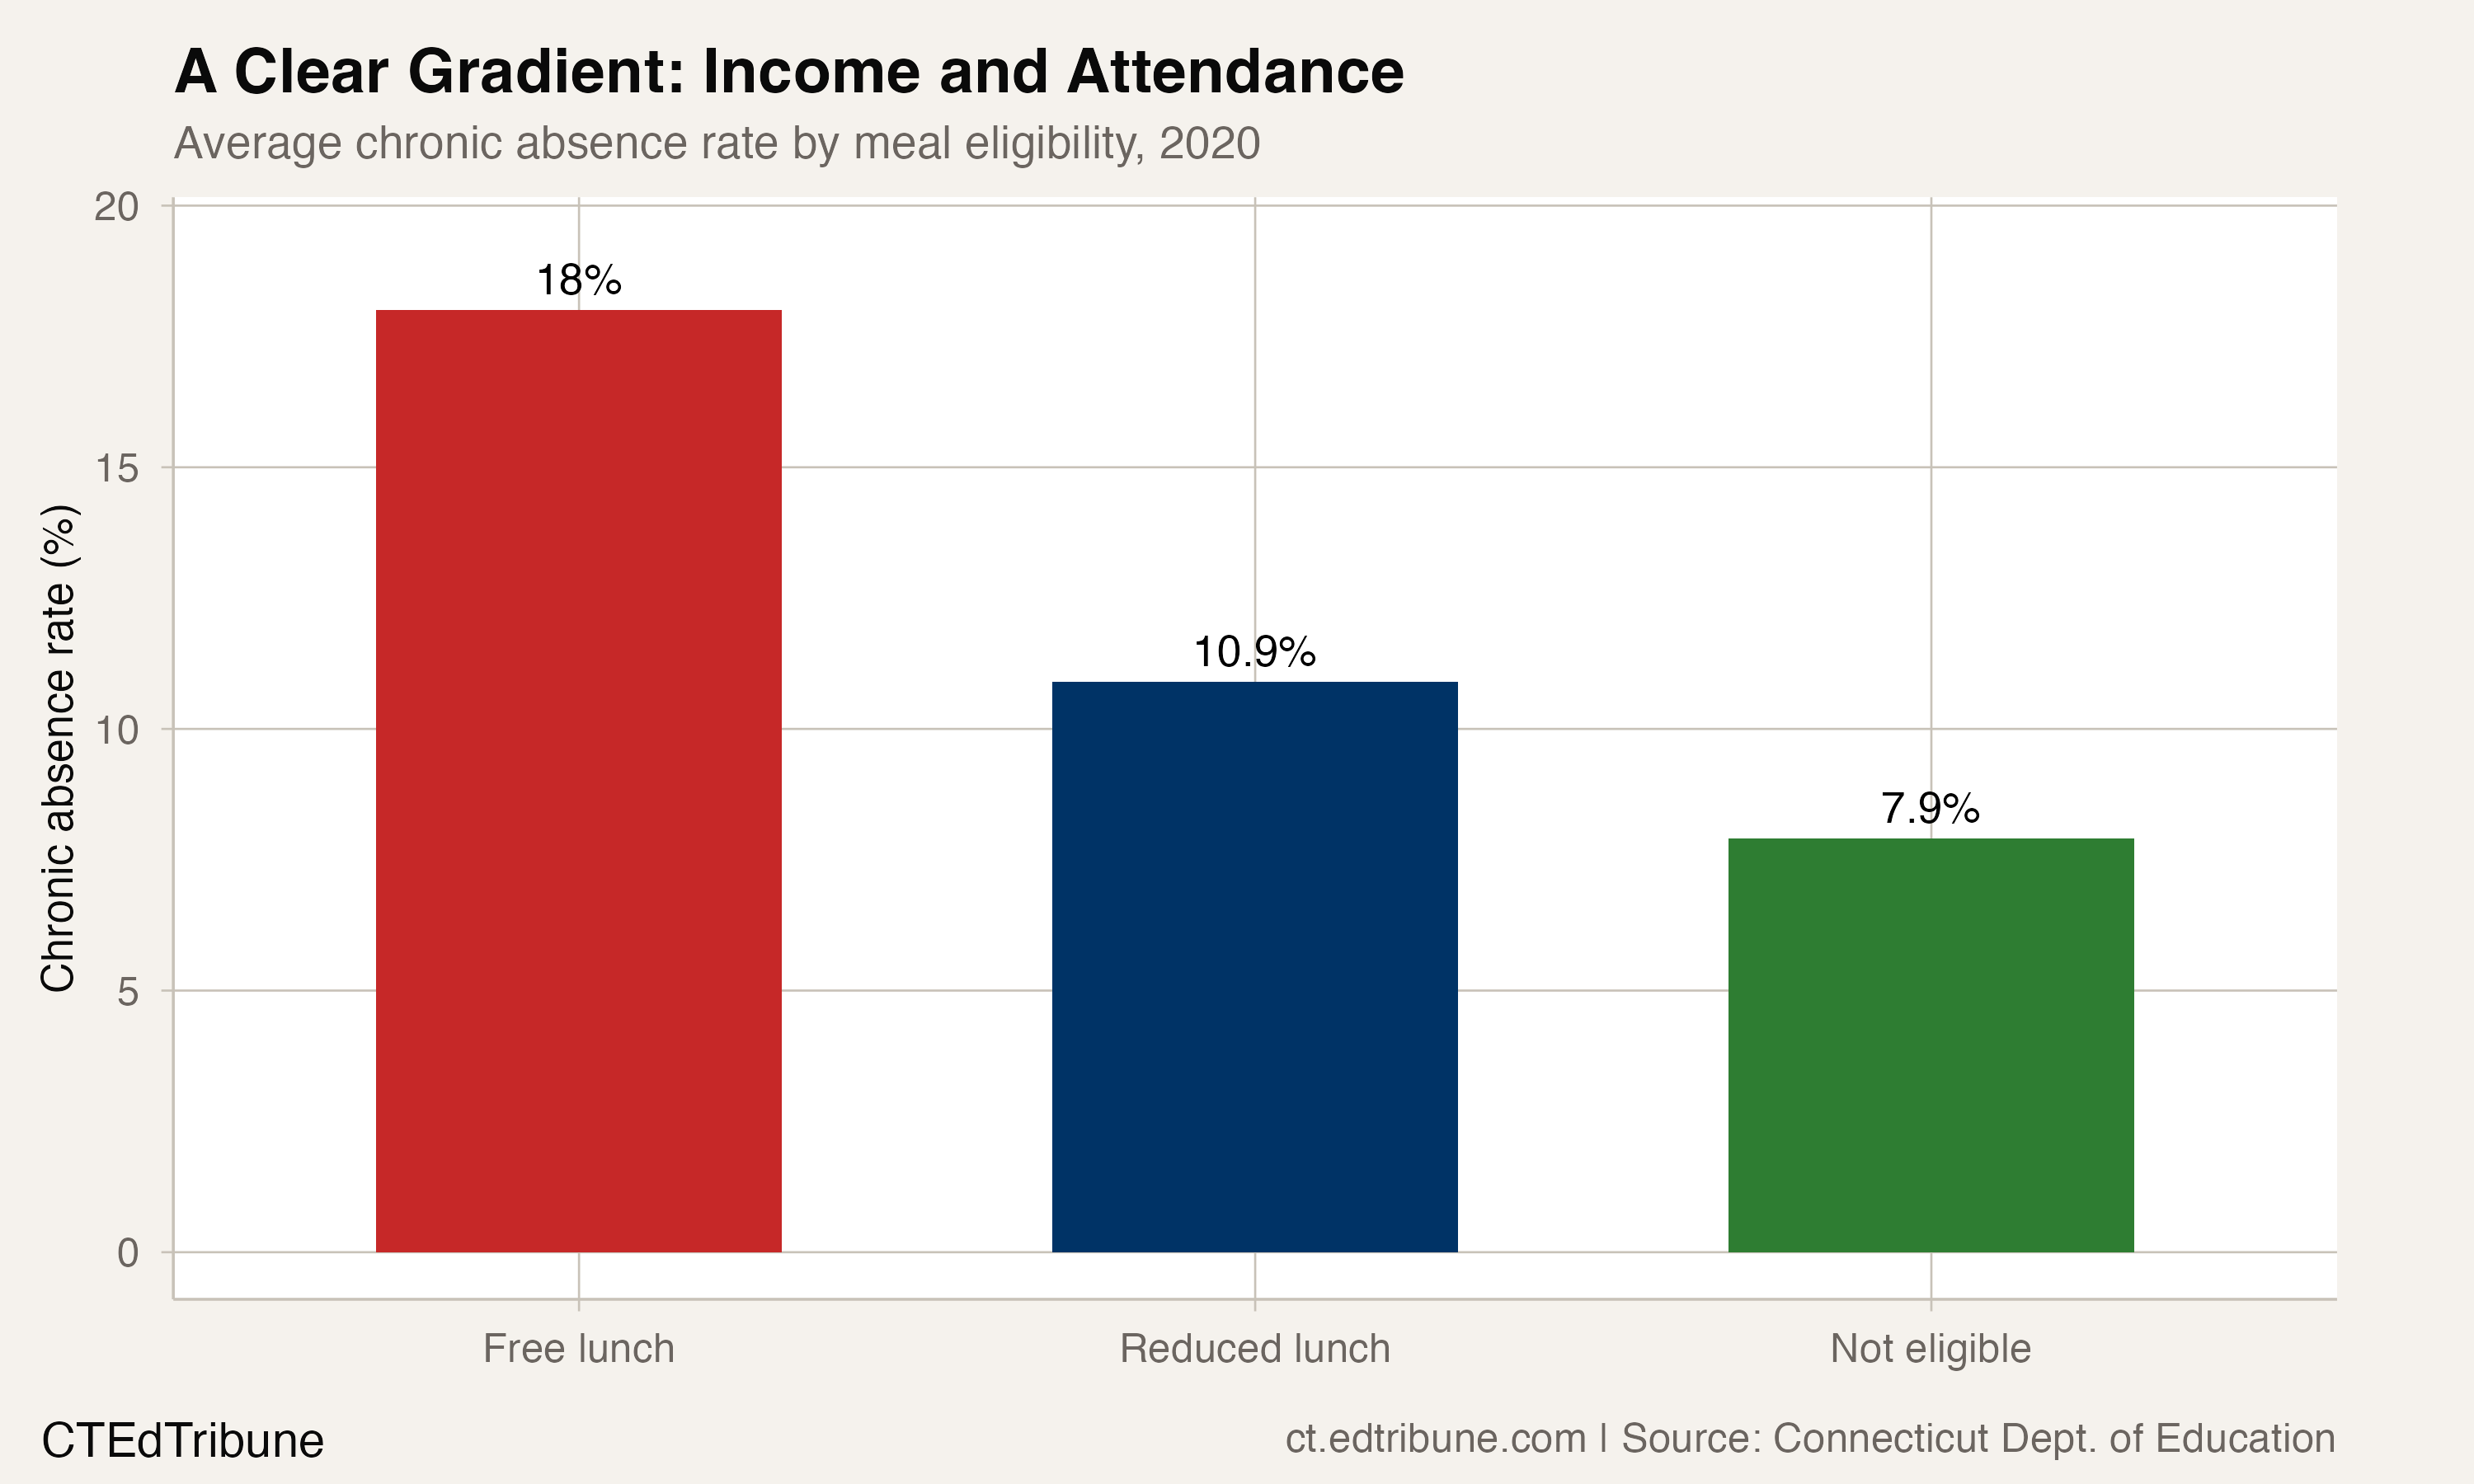
Reduced-lunch students — families earning 130-185% of the federal poverty level — fell almost exactly between the two extremes. The gradient is nearly linear: each step down the income ladder adds roughly 5 percentage points of chronic absence. This pattern held across all nine years in the dataset, with reduced-lunch rates consistently falling between the other two groups.
The gradient suggests that chronic absenteeism is not a binary condition that either does or does not exist based on poverty status. It scales with economic pressure, which aligns with research from CT Voices documenting Connecticut's position as the third-worst state for education equality nationally.
Where the gap is widest
At the district level, the poverty-attendance gap varied enormously. Woodstock Academy had the widest gap in 2020: 38.1% for free-lunch students versus 9.6% for non-eligible peers, a 28.5 percentage-point chasm. Oxford School District followed at 21.7 points (29.5% vs 7.8%).
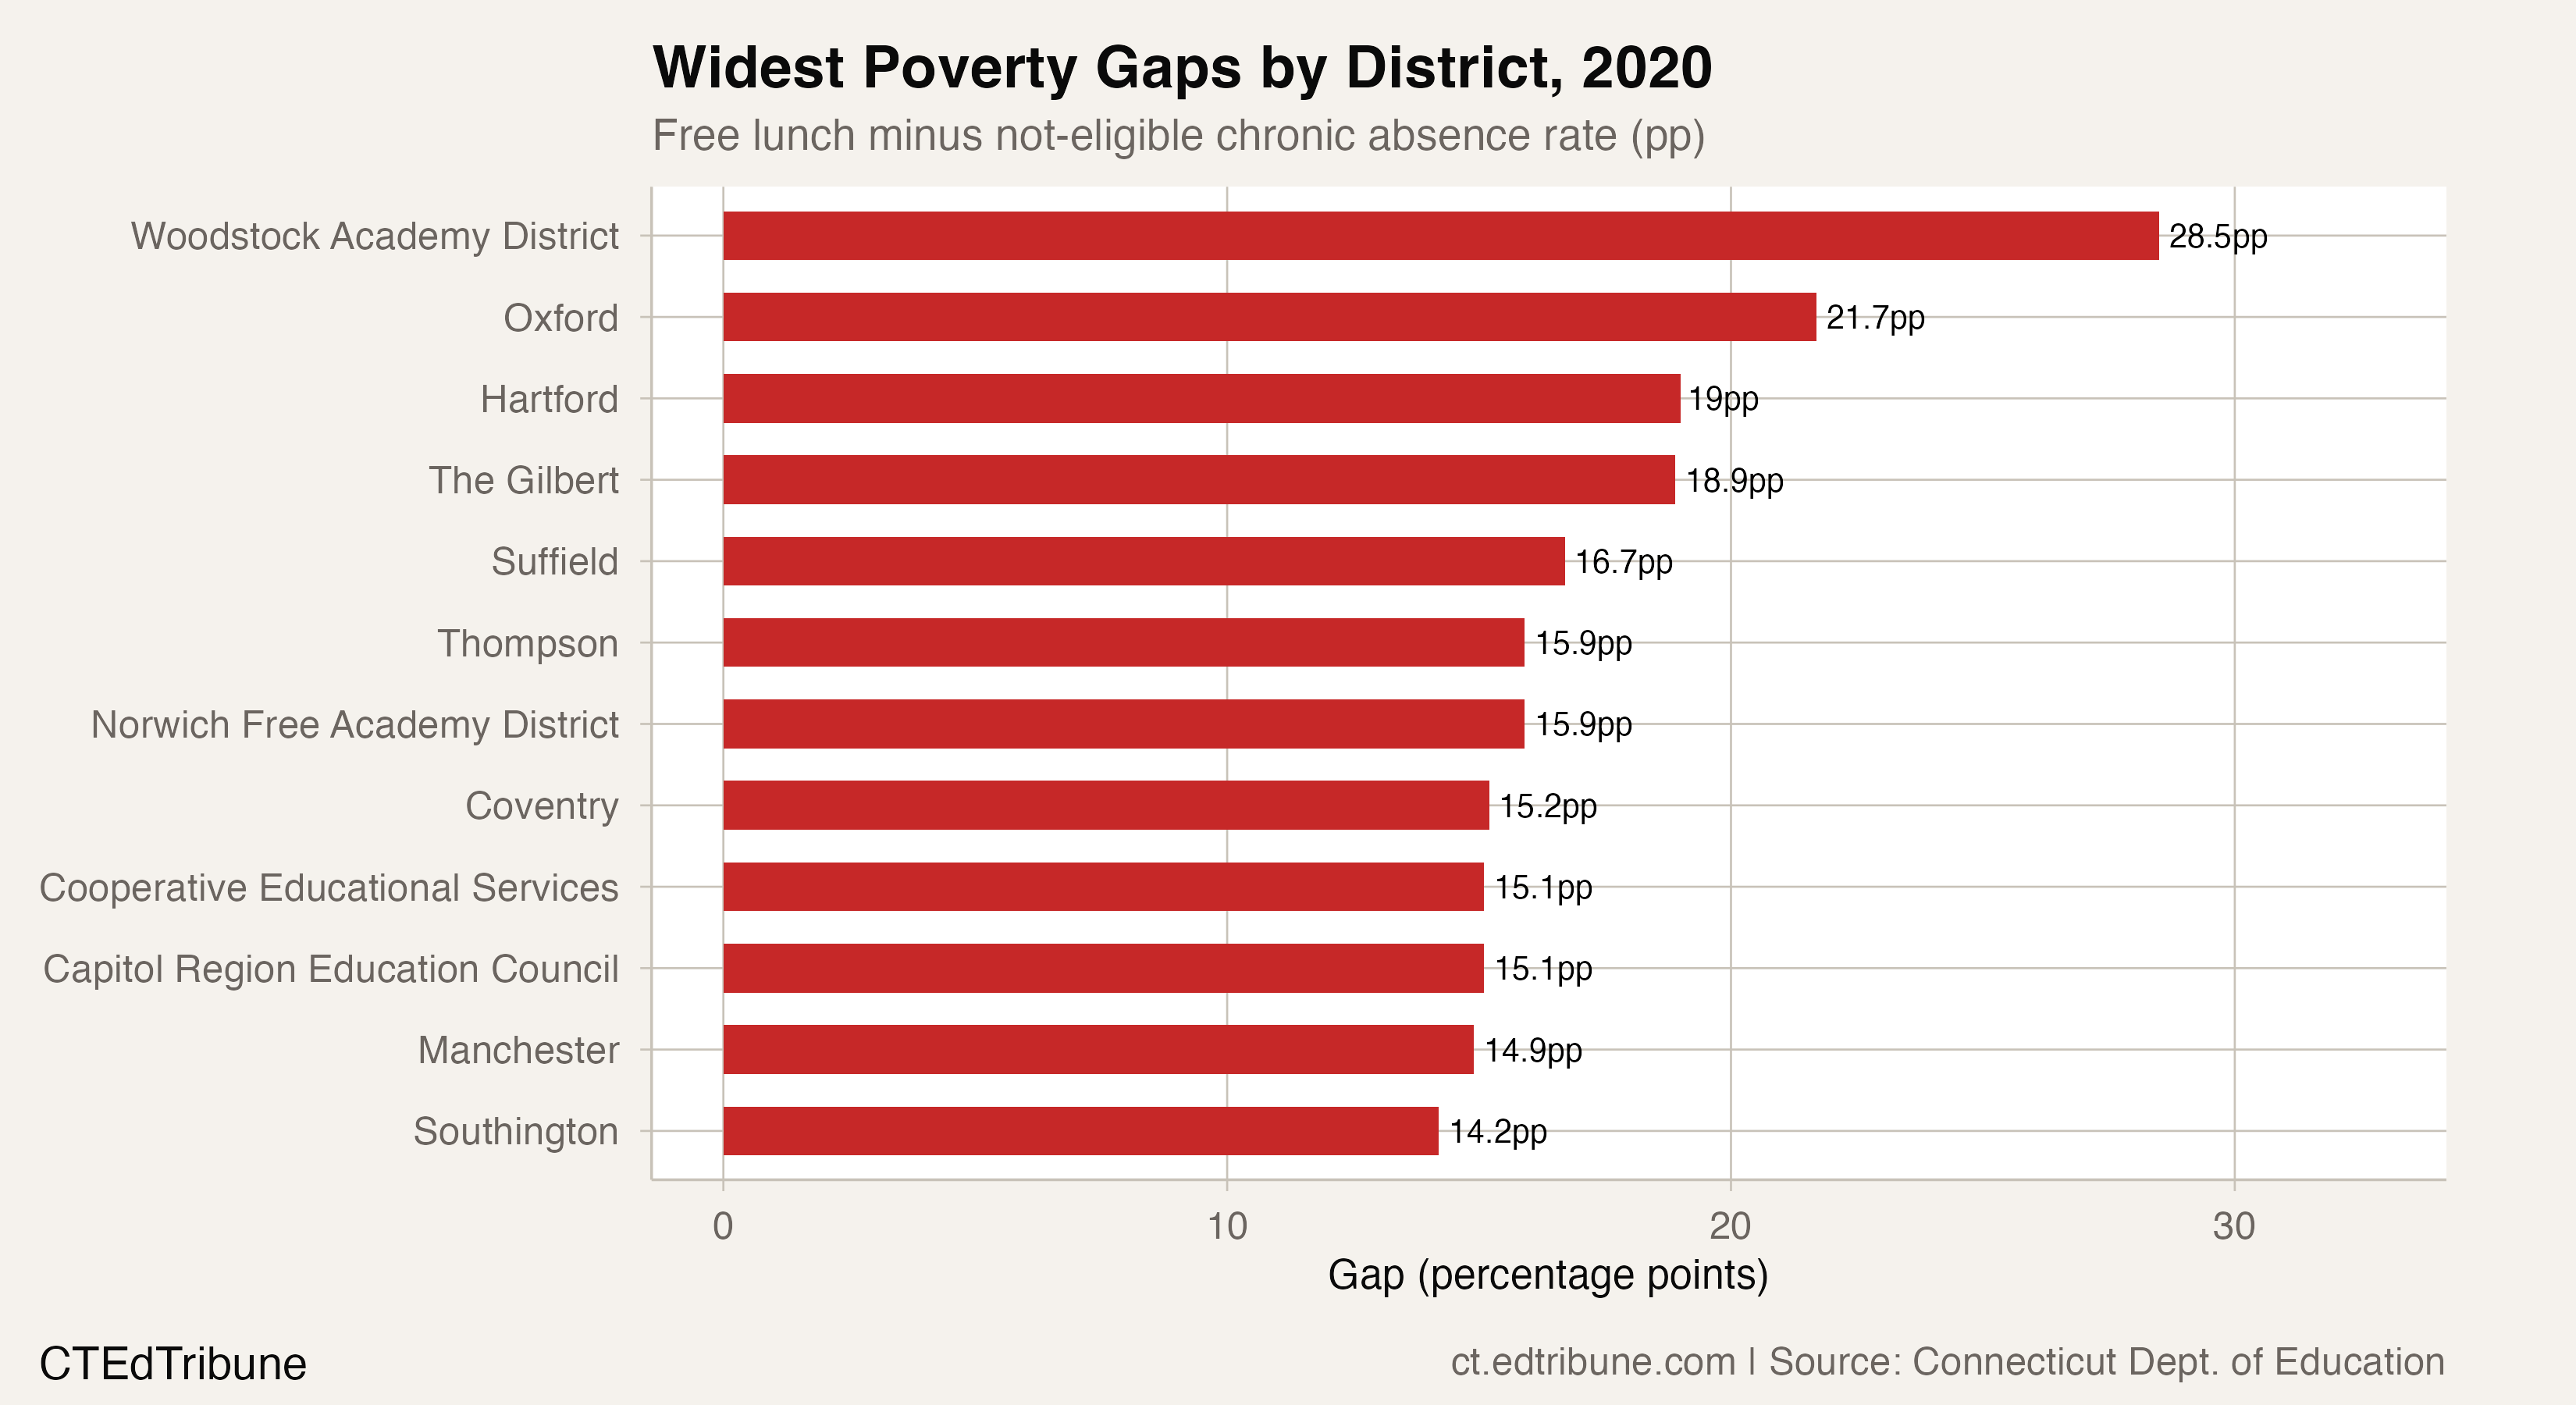
Hartford↗ET ranked third with a 19.0-point gap — but here the dynamics differ from the suburban districts. Hartford's non-eligible rate of 12.3% was itself far above the state average, meaning even Hartford's most economically secure students had chronic absence rates that would be alarming in most districts. Hartford's free-lunch rate of 31.3% represents a level of disengagement that is difficult to address through school-level interventions alone.
The districts with the smallest gaps tended to be those where both groups were relatively low — not districts that had successfully closed the gap by improving outcomes for students from low-income families. The gap closes easiest where chronic absenteeism is not a significant problem for anyone.
Nine years of a gap that would not close
One important caveat: meal eligibility data covers only about 130 of Connecticut's 204 districts in any given year. The missing districts may include some with the most extreme gaps.
Connecticut's LEAP home-visitation program, launched in 2021, was designed to address the root causes -- transportation, housing, healthcare -- that keep low-income students home. Early results are striking: a 15 percentage-point average improvement in attendance within six months of a home visit.
But the pre-COVID data delivers a sobering context for that optimism. The gap persisted across nine years without meaningful change. Whatever forces drove the 9.7-point disparity in 2012 were still fully operational in 2020, producing a 10.1-point gap. LEAP may be the first intervention with enough intensity to crack it. Or it may turn out to be another temporary fix atop a permanent divide.
Detailed code that reproduces the analysis and figures in this article is available exclusively to EdTribune subscribers.
Discussion
Sign in to join the discussion.
Loading comments...