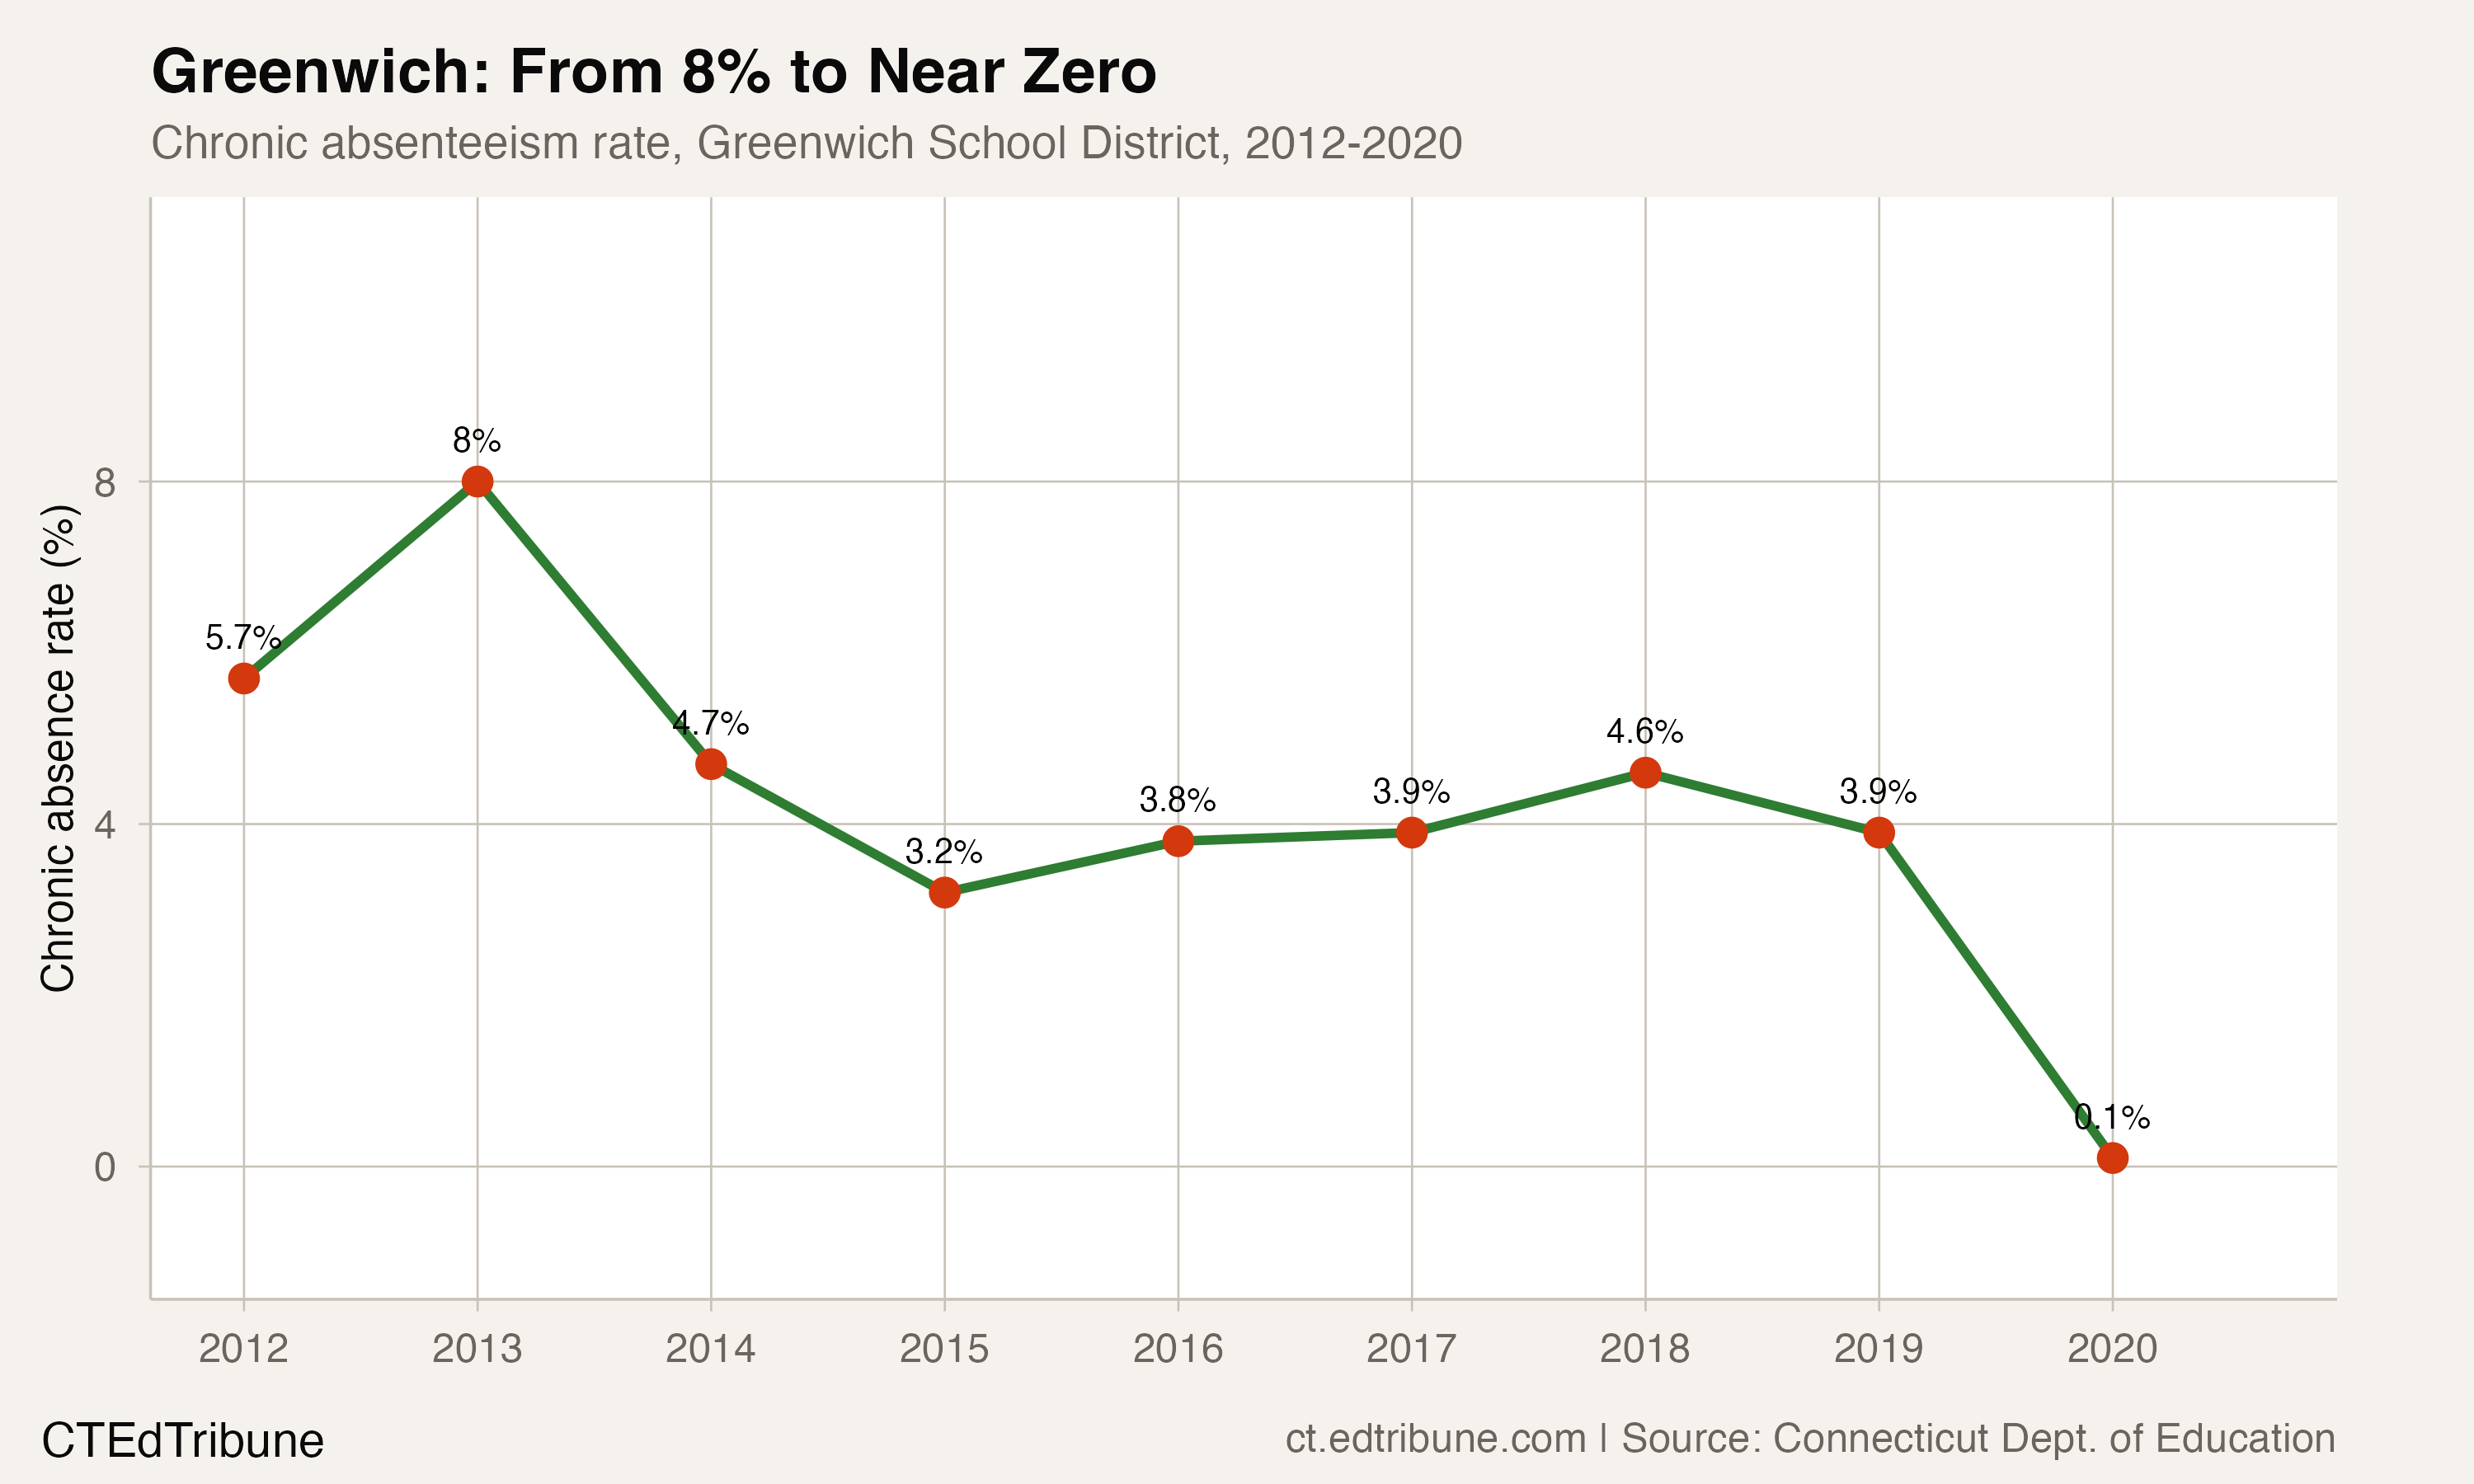
In a year when 78 Connecticut districts hit their worst-ever chronic absenteeism rates, Greenwich↗ET did the opposite. The district's 2020 chronic absence rate was 0.1% — essentially zero. One student in a thousand.
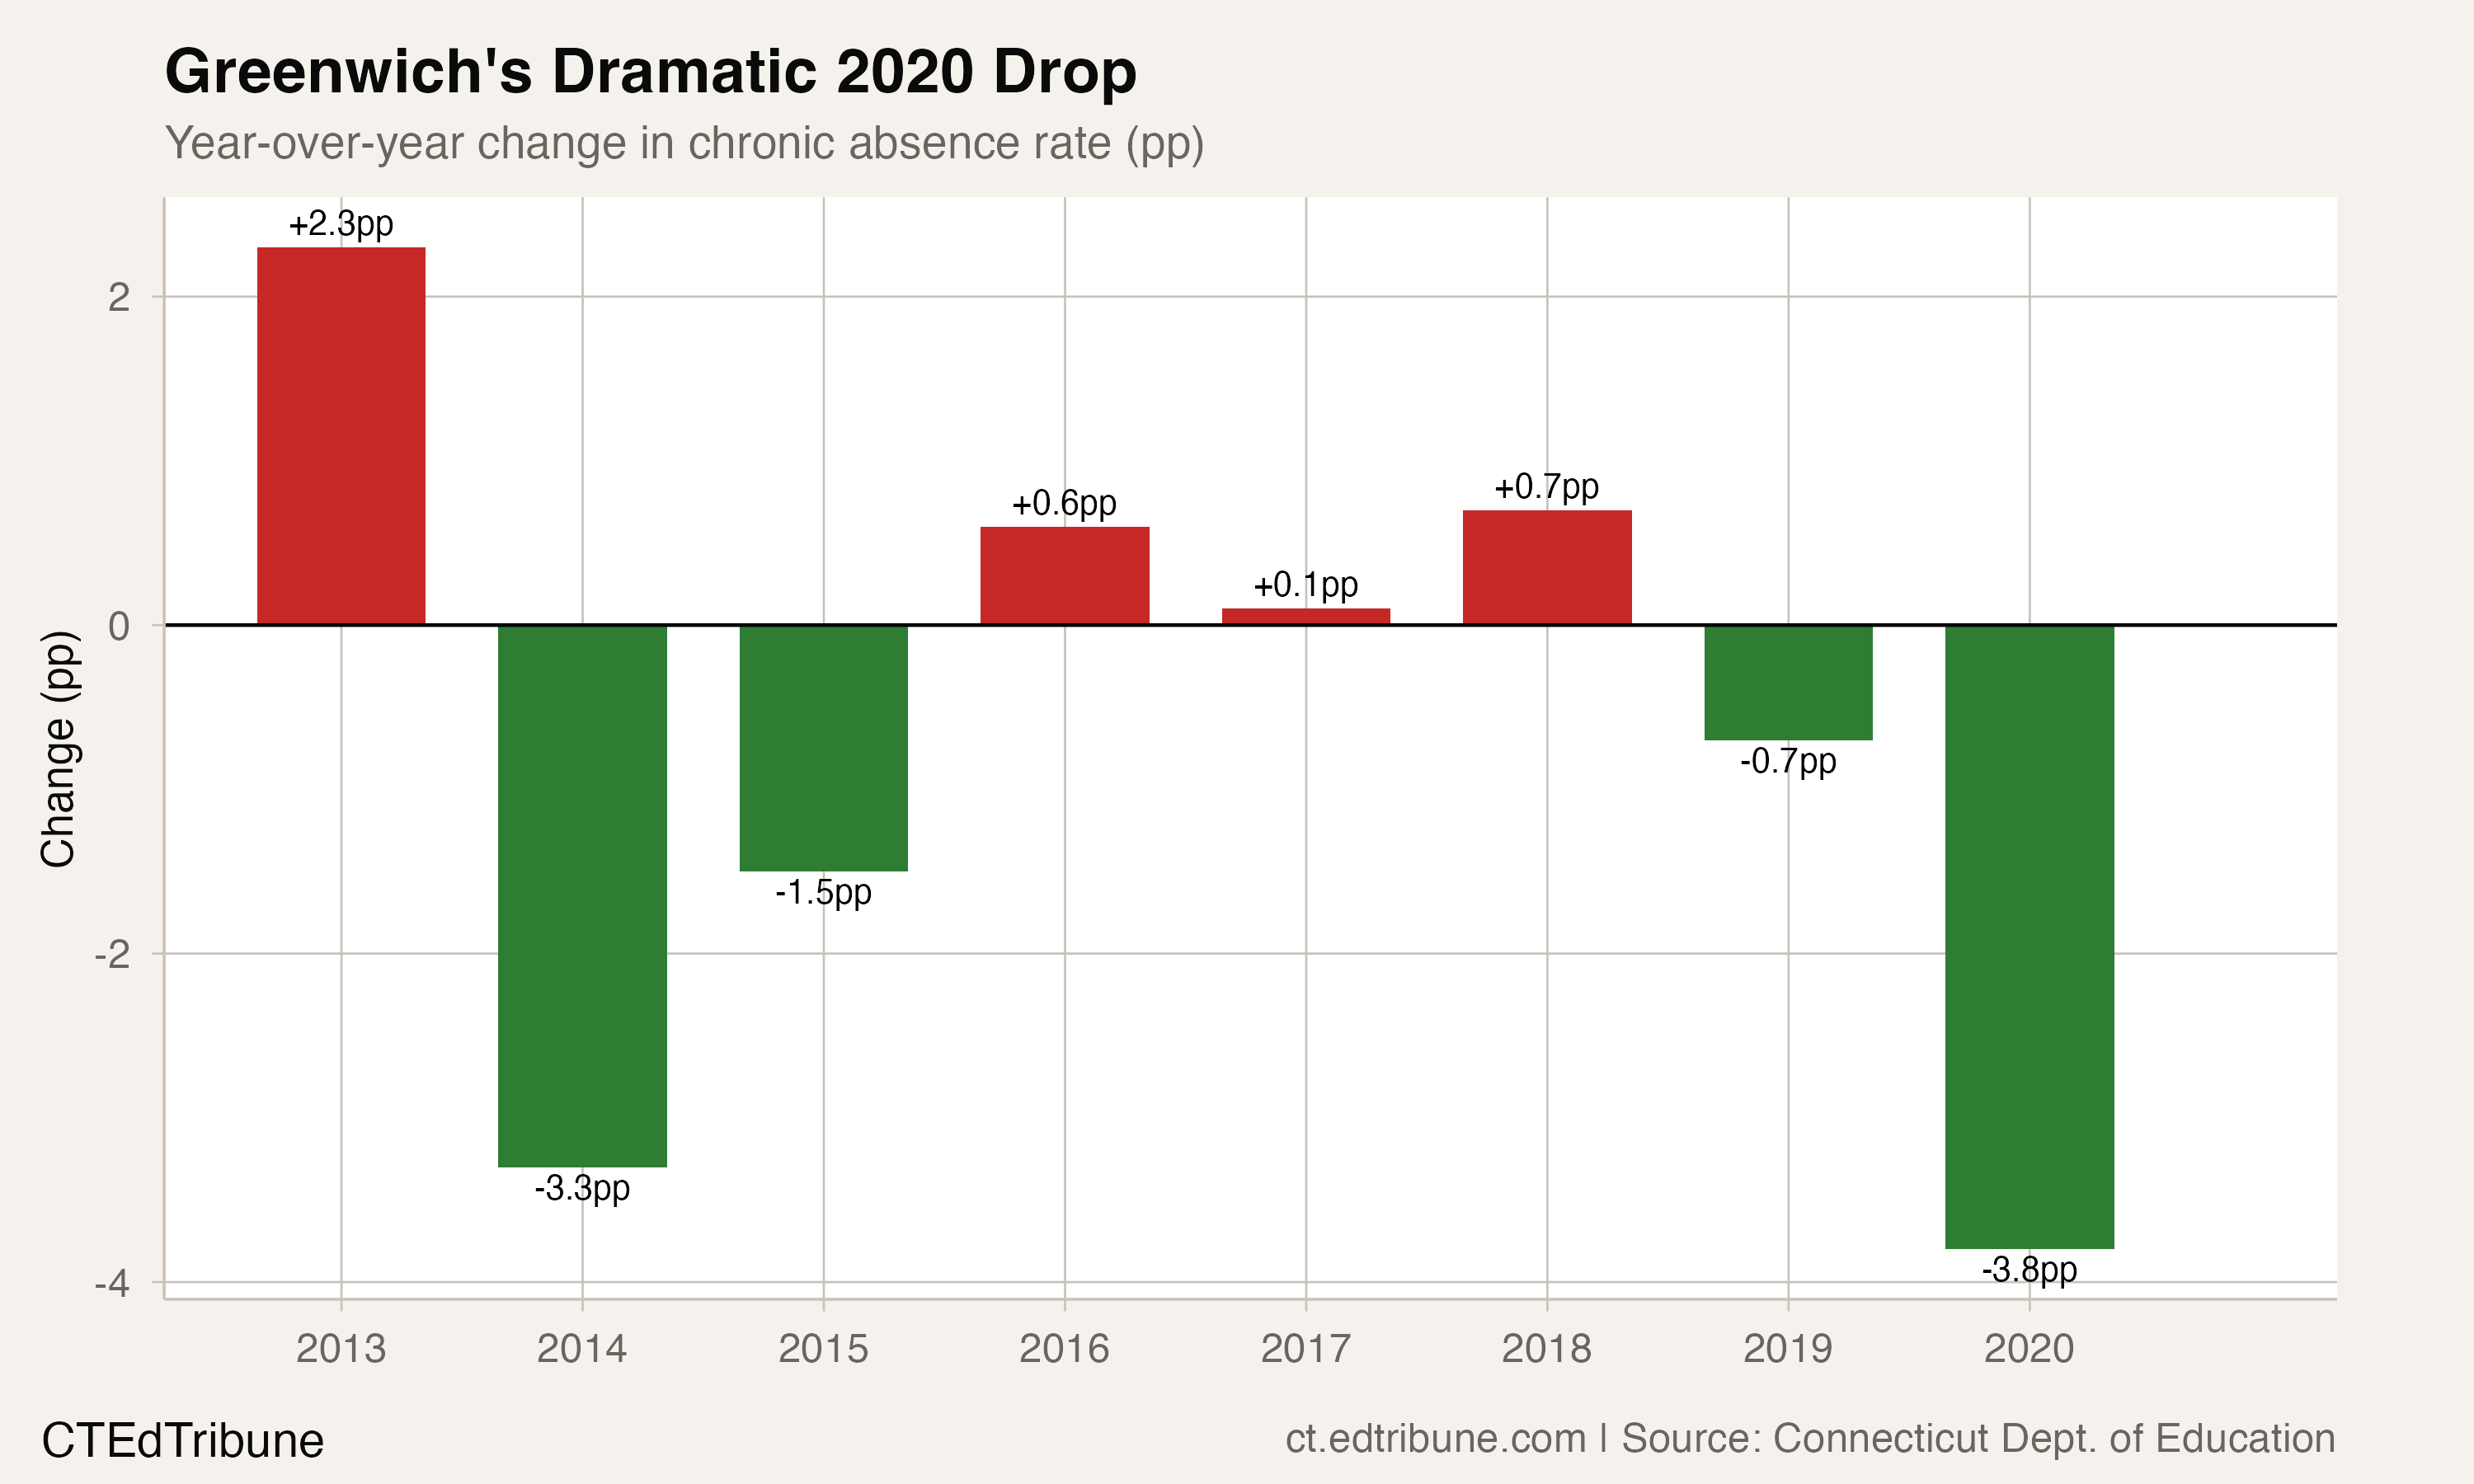
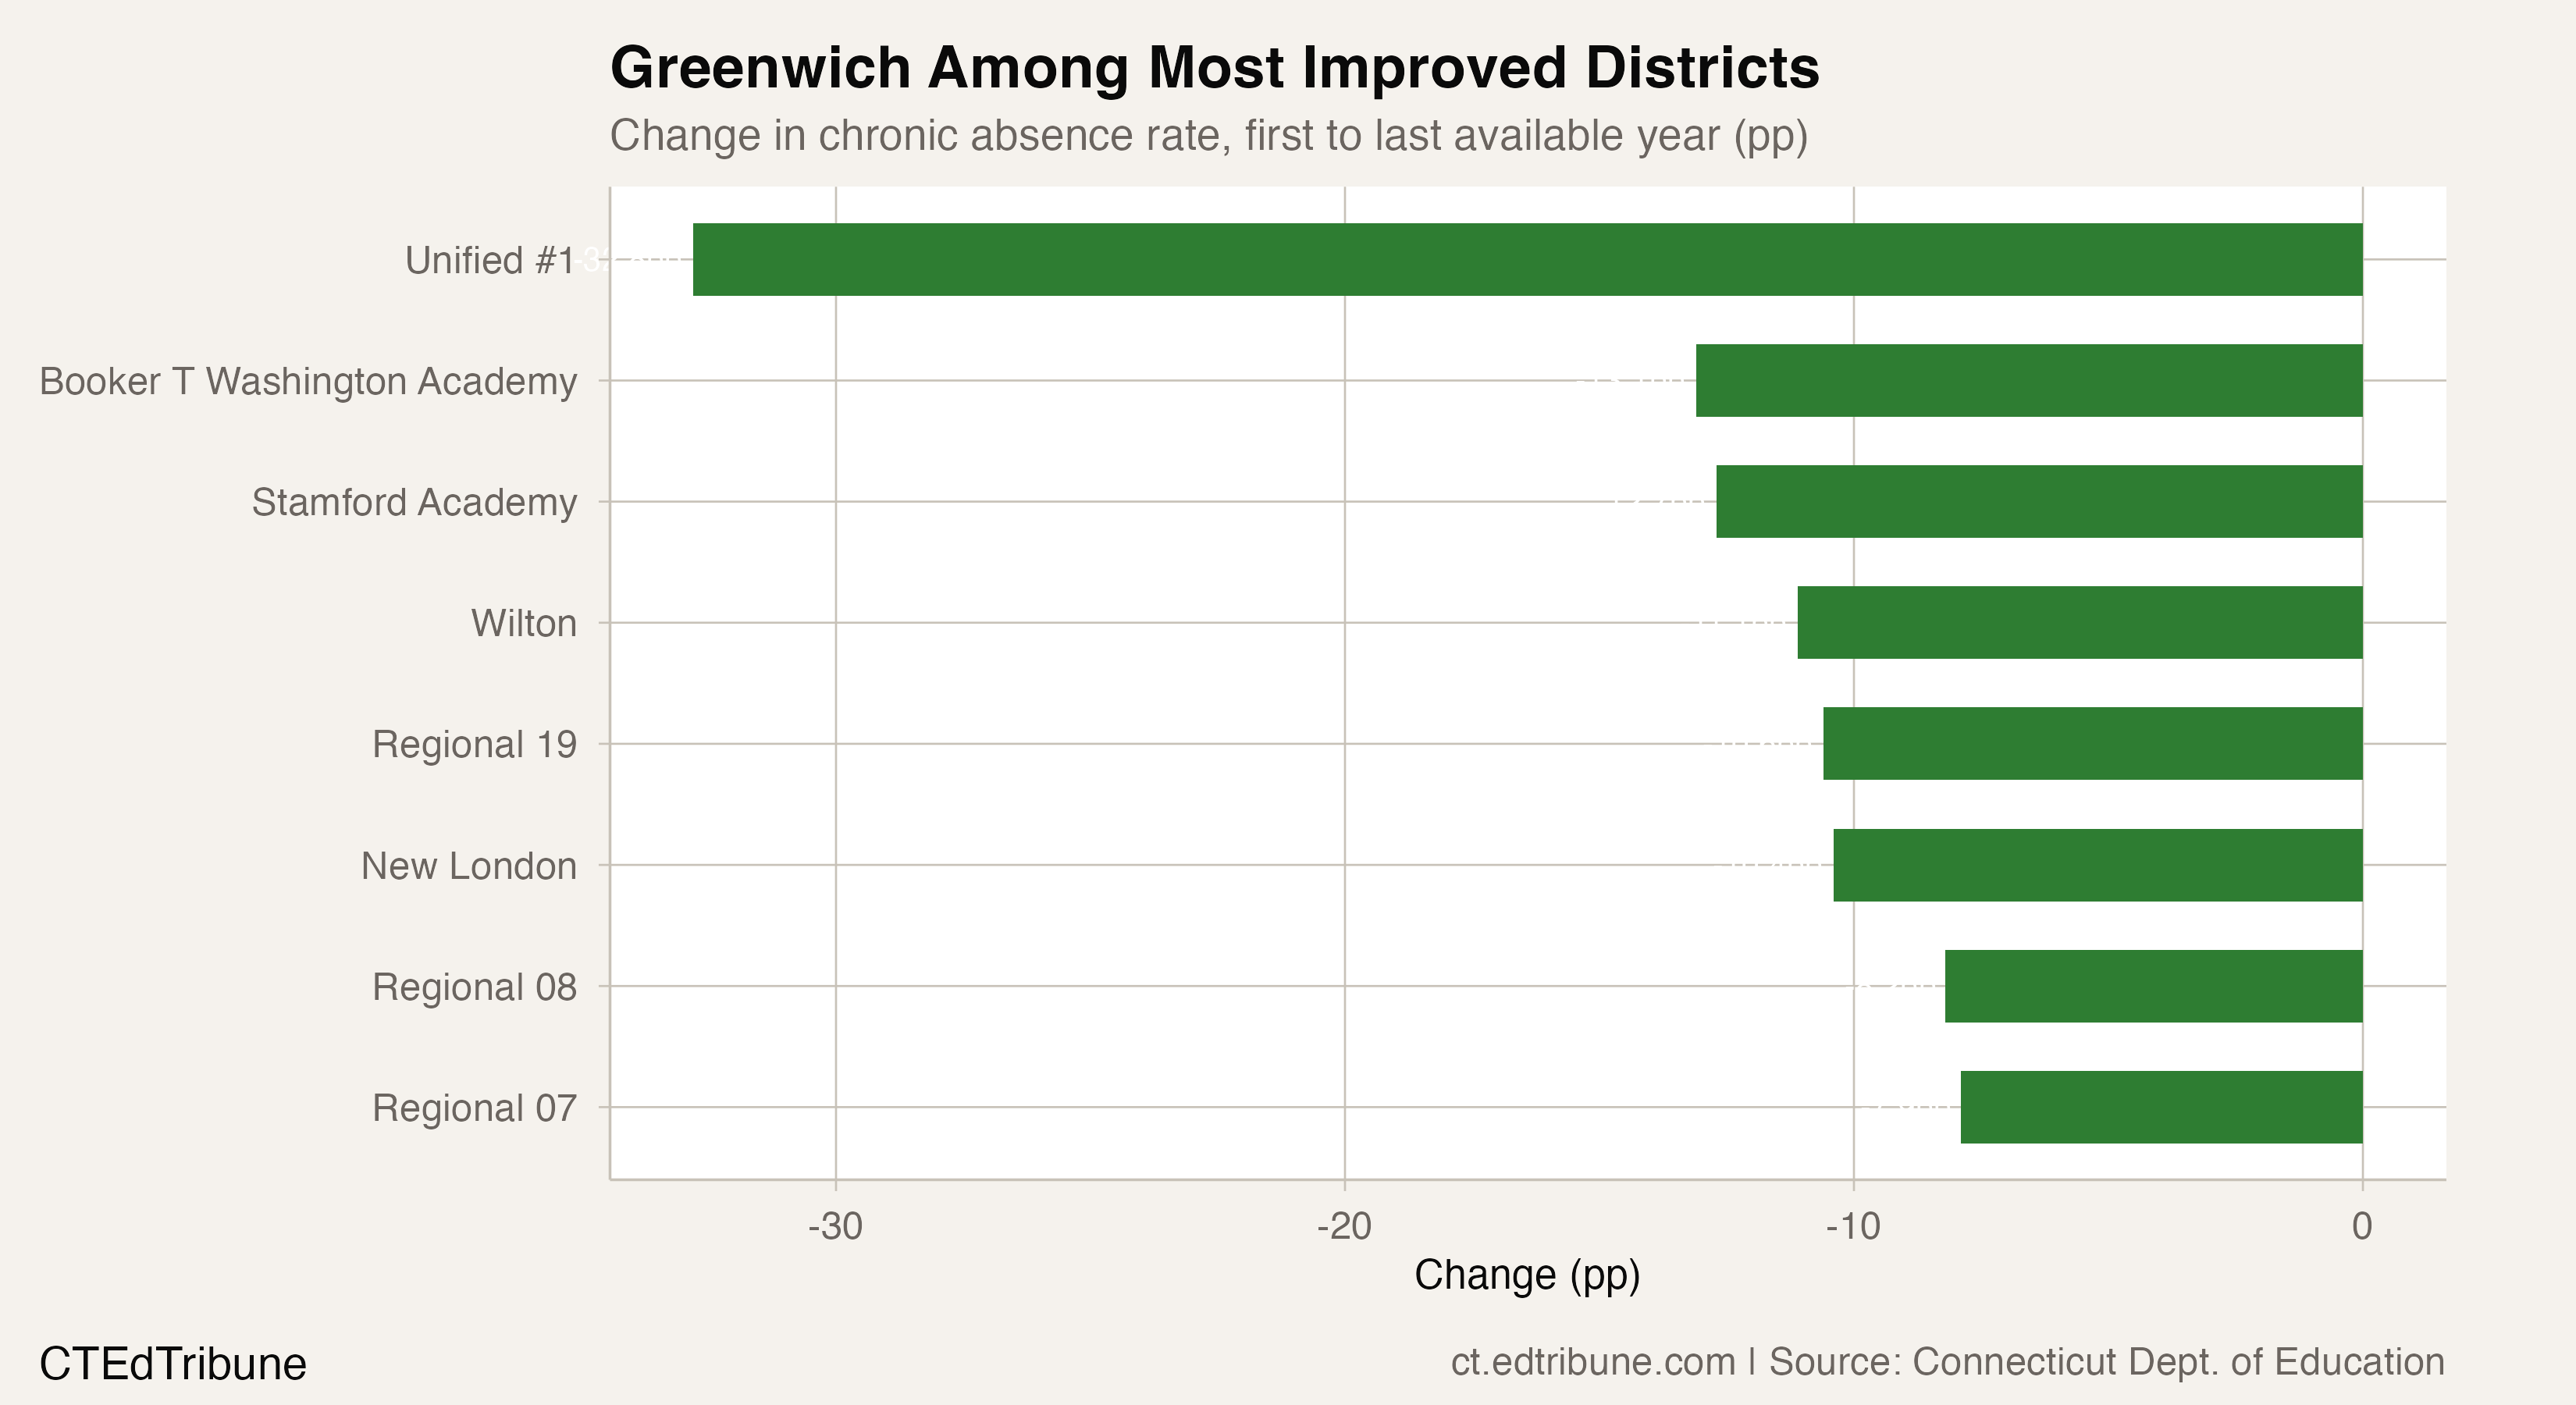
Eight districts reached their all-time low in the pandemic-shortened 2019-20 school year. Greenwich's number was the most striking: a 7.9 percentage-point improvement from its 2013 peak of 8.0%, achieved in the same year that schools closed for three months and the statewide rate spiked to its highest level on record.
An irregular path to near-zero
Greenwich's trajectory was not a smooth decline. The rate jumped from 5.7% in 2012 to 8.0% in 2013 — the district's worst year — then dropped sharply to 4.7% in 2014 and 3.2% in 2015. From 2015 to 2019, the rate hovered between 3.2% and 4.6%, fluctuating without a clear trend. Then 2020 produced the dramatic drop to 0.1%.
The inconsistency matters. Greenwich did not engineer seven years of steady improvement. It had a volatile period, a plateau in the mid-to-high 3% range, and then a single-year plunge that looks more like a statistical artifact of the shortened school year than a culmination of sustained effort.
With fewer school days in the denominator — roughly 120 instead of 180 after March closures — students needed to miss fewer days to be classified as chronically absent under Connecticut's 10% threshold. In a district where baseline absence was already low, the shortened calendar may have simply prevented most students from accumulating enough absences to cross the line.
The Gold Coast diverged
Greenwich's near-elimination of chronic absence stands out even among its wealthy Fairfield County neighbors. In 2020, Darien↗ET posted 5.2%, Westport↗ET 8.4%, and Ridgefield 8.5%. Wilton↗ET at 4.4% was the closest peer.
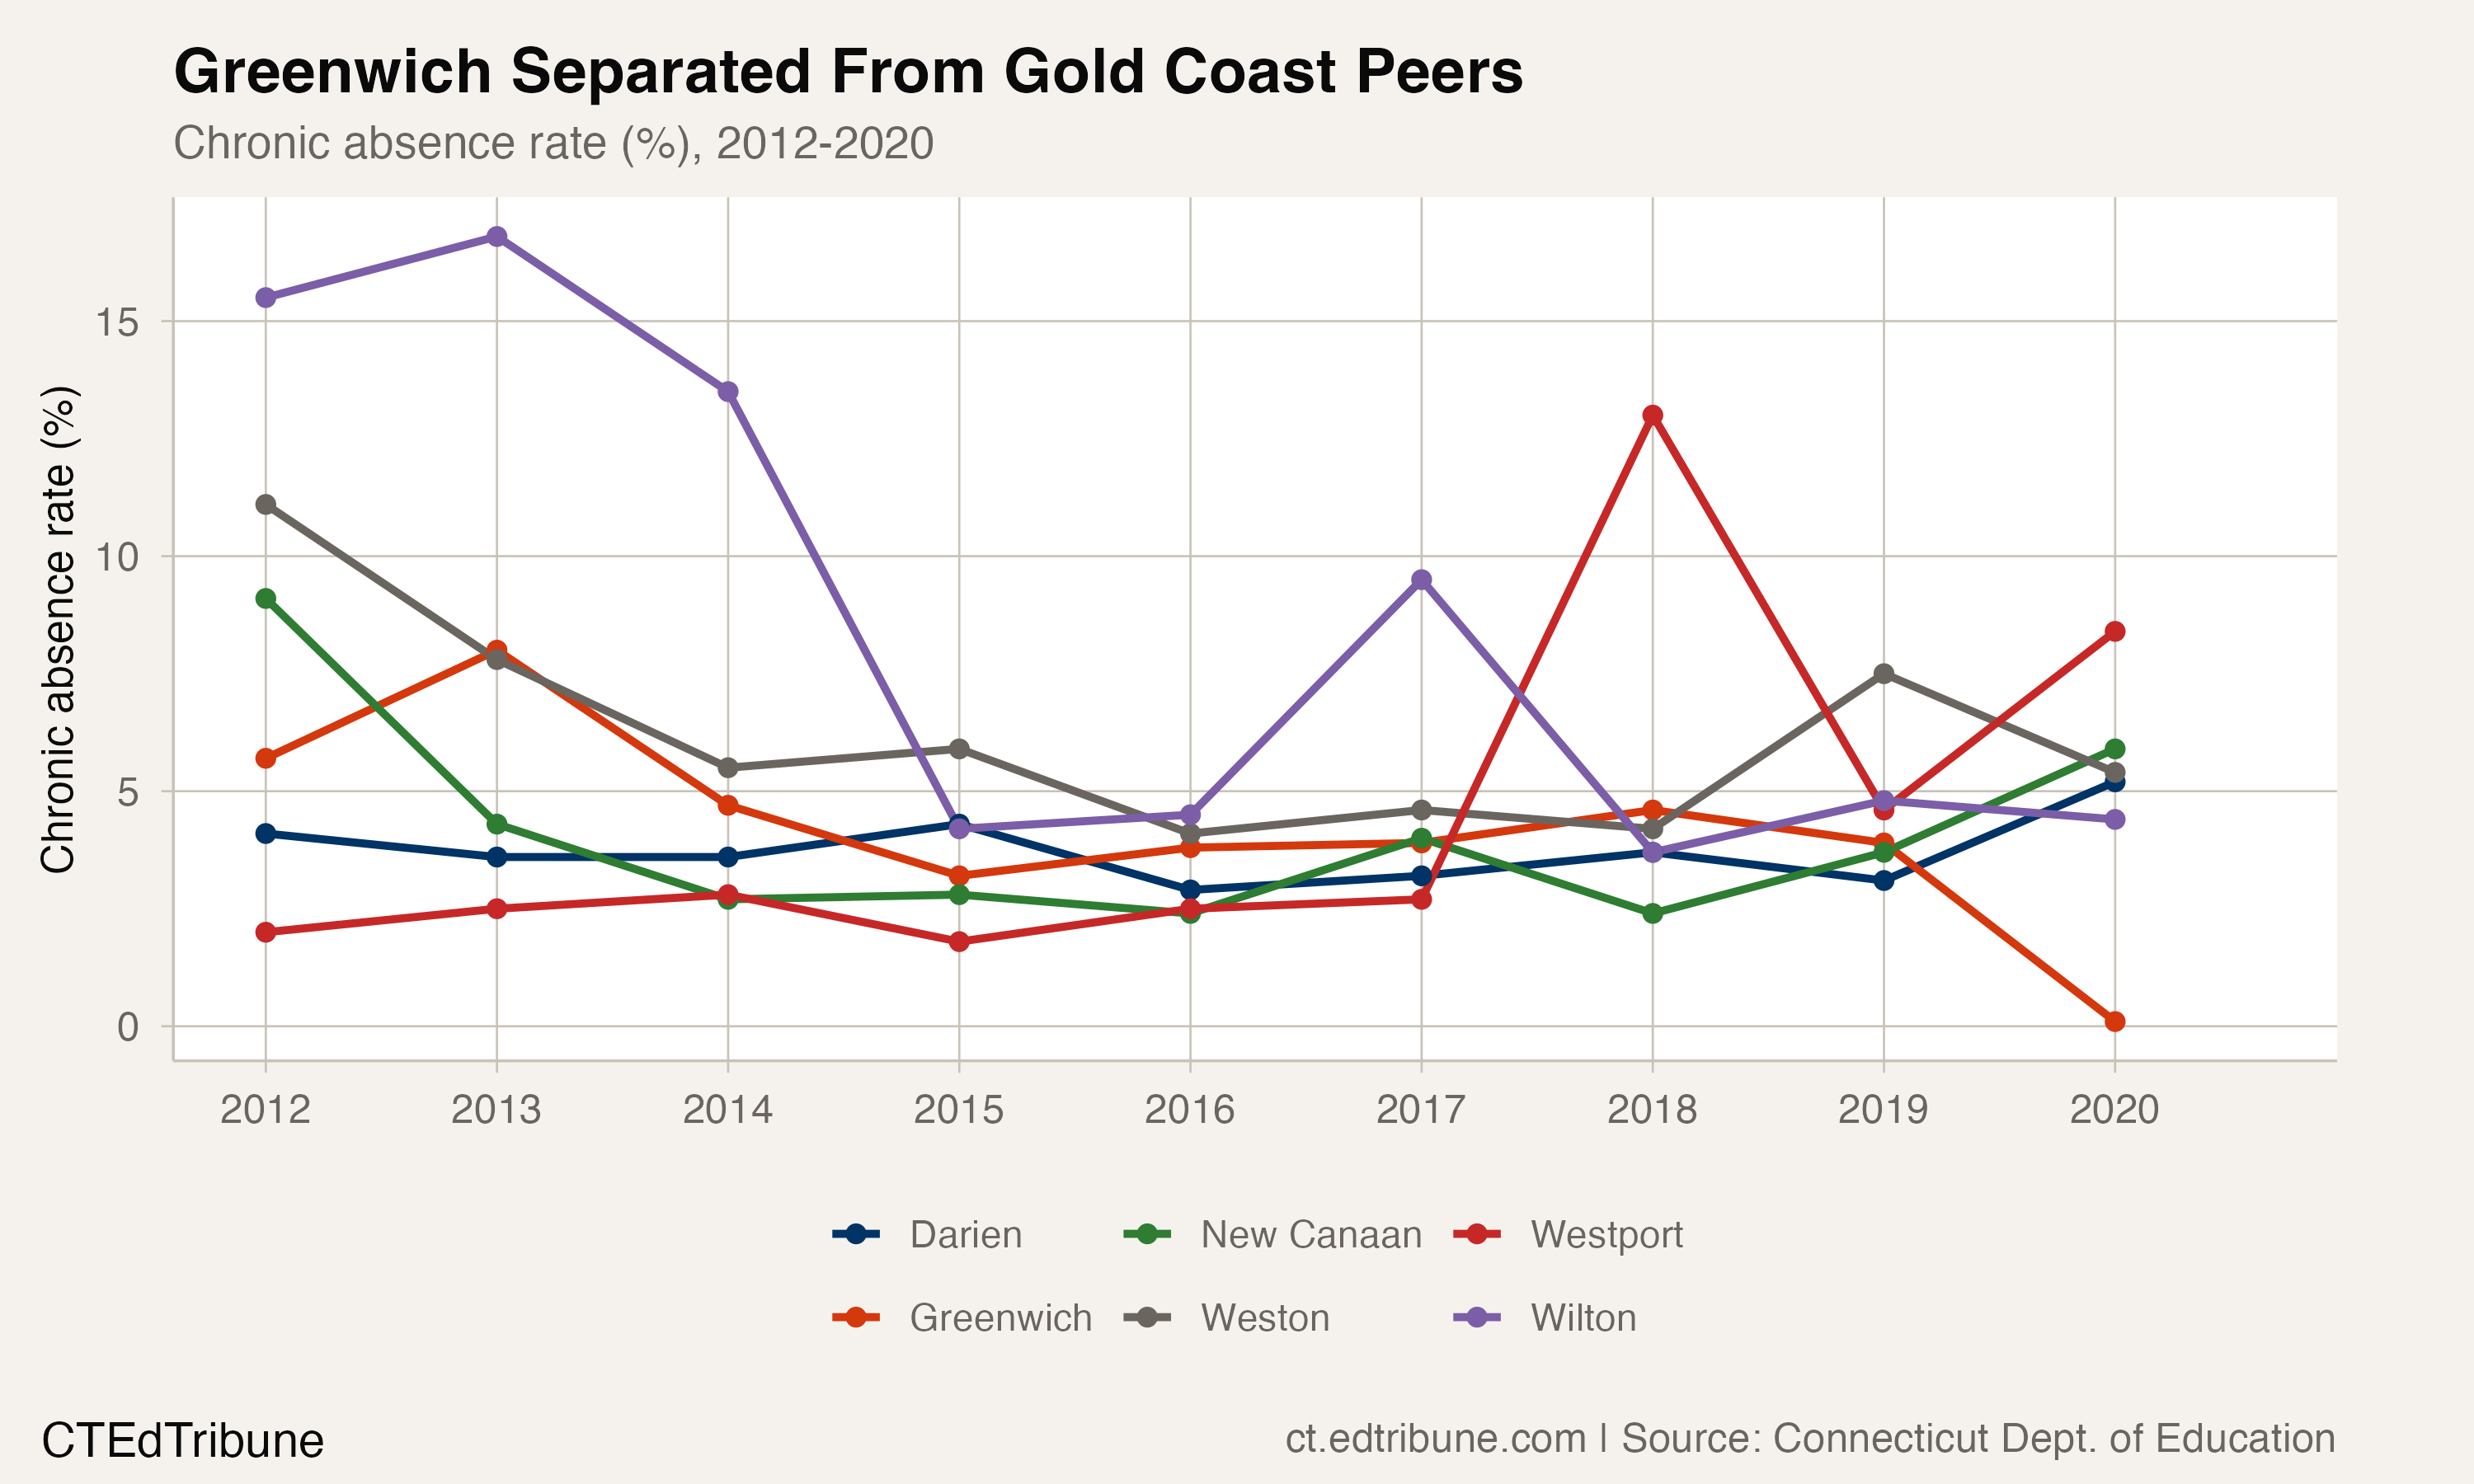
The divergence is notable because these districts share similar demographics — high household incomes, well-funded schools, predominantly white student populations. If Greenwich's 0.1% reflected pure demographics, its peers should be closer to zero too. The fact that Westport and Ridgefield were 80 times higher suggests that either Greenwich implemented something its neighbors did not, or the measurement dynamics of the shortened year affected Greenwich differently.
Greenwich's Achievement Gap Task Force has studied internal disparities within the district, noting significant differences in outcomes across the district's elementary schools. The task force's work suggests that even within Greenwich, attendance and achievement are not uniformly excellent — making the 0.1% aggregate figure even more striking.
What Greenwich's number does and does not prove
Greenwich's trajectory proves that chronic absenteeism below 5% is achievable on a sustained basis — the district maintained rates between 3% and 5% for five consecutive years before the 2020 plunge. It demonstrates that affluent districts can keep the problem small.
It does not prove that Greenwich "solved" chronic absenteeism in 2020. The 0.1% figure is almost certainly an artifact of the pandemic's compression of the school calendar, not evidence that only one student in a thousand was at risk of disengagement. Greenwich's gender data supports this interpretation: the district did not report gender-disaggregated chronic absence data for 2020, an unusual gap that may indicate the numbers were too small for disaggregation to be meaningful — or that the measurement was recognized as anomalous.
The more honest baseline is the 3-4% range that Greenwich maintained from 2015 to 2019. That range represents genuine low chronic absence in one of the state's best-resourced districts.
The districts that joined Greenwich at the bottom
Seven other districts hit their all-time low in 2020:
- Brookfield at 0.5%
- Lisbon at 4.4%
- Chaplin at 5.6%
- Somers at 6.8%
- Branford at 6.9%
- Stamford Charter School for Excellence at 6.9%
- Regional School District 09 at 7.8%
The mix is notable. Brookfield is another affluent suburb. Chaplin is a small rural district whose 4-year improvement streak from 2017 to 2020 appears to be genuine. Branford is a mid-size coastal district. Stamford Charter School for Excellence is a charter school — the only non-traditional district to reach an all-time low during the pandemic year.
These eight districts represent 4.3% of the 187 districts with sufficient data. The other 95.7% either hit their worst-ever rate or fell somewhere between their historical extremes.
The real baseline is 3-4%, not zero
Greenwich's pre-COVID floor is roughly 3-4% -- well below the statewide average, but not zero. The 0.1% figure from 2020 is almost certainly a measurement artifact of the shortened school year, not evidence that Greenwich solved chronic absenteeism.
What happened after 2020 is not in this dataset. Connecticut's statewide rate spiked to 23.7% in 2021-22, and presumably even Greenwich felt some of that. If the district maintained its sub-5% rate through the worst of the pandemic, that would be genuinely exceptional. If it spiked like most districts, the 0.1% becomes a footnote -- a measurement quirk sandwiched between a district's real story of keeping chronic absence low without being able to eliminate it.
Detailed code that reproduces the analysis and figures in this article is available exclusively to EdTribune subscribers.
Discussion
Sign in to join the discussion.
Loading comments...