Correction (April 18, 2026): An earlier version of this article described a 2024 enrollment "jump" of 18,643 students. That figure reflected a reporting artifact, not a real enrollment gain. The narrative has been corrected. See the milestone article correction for full details.
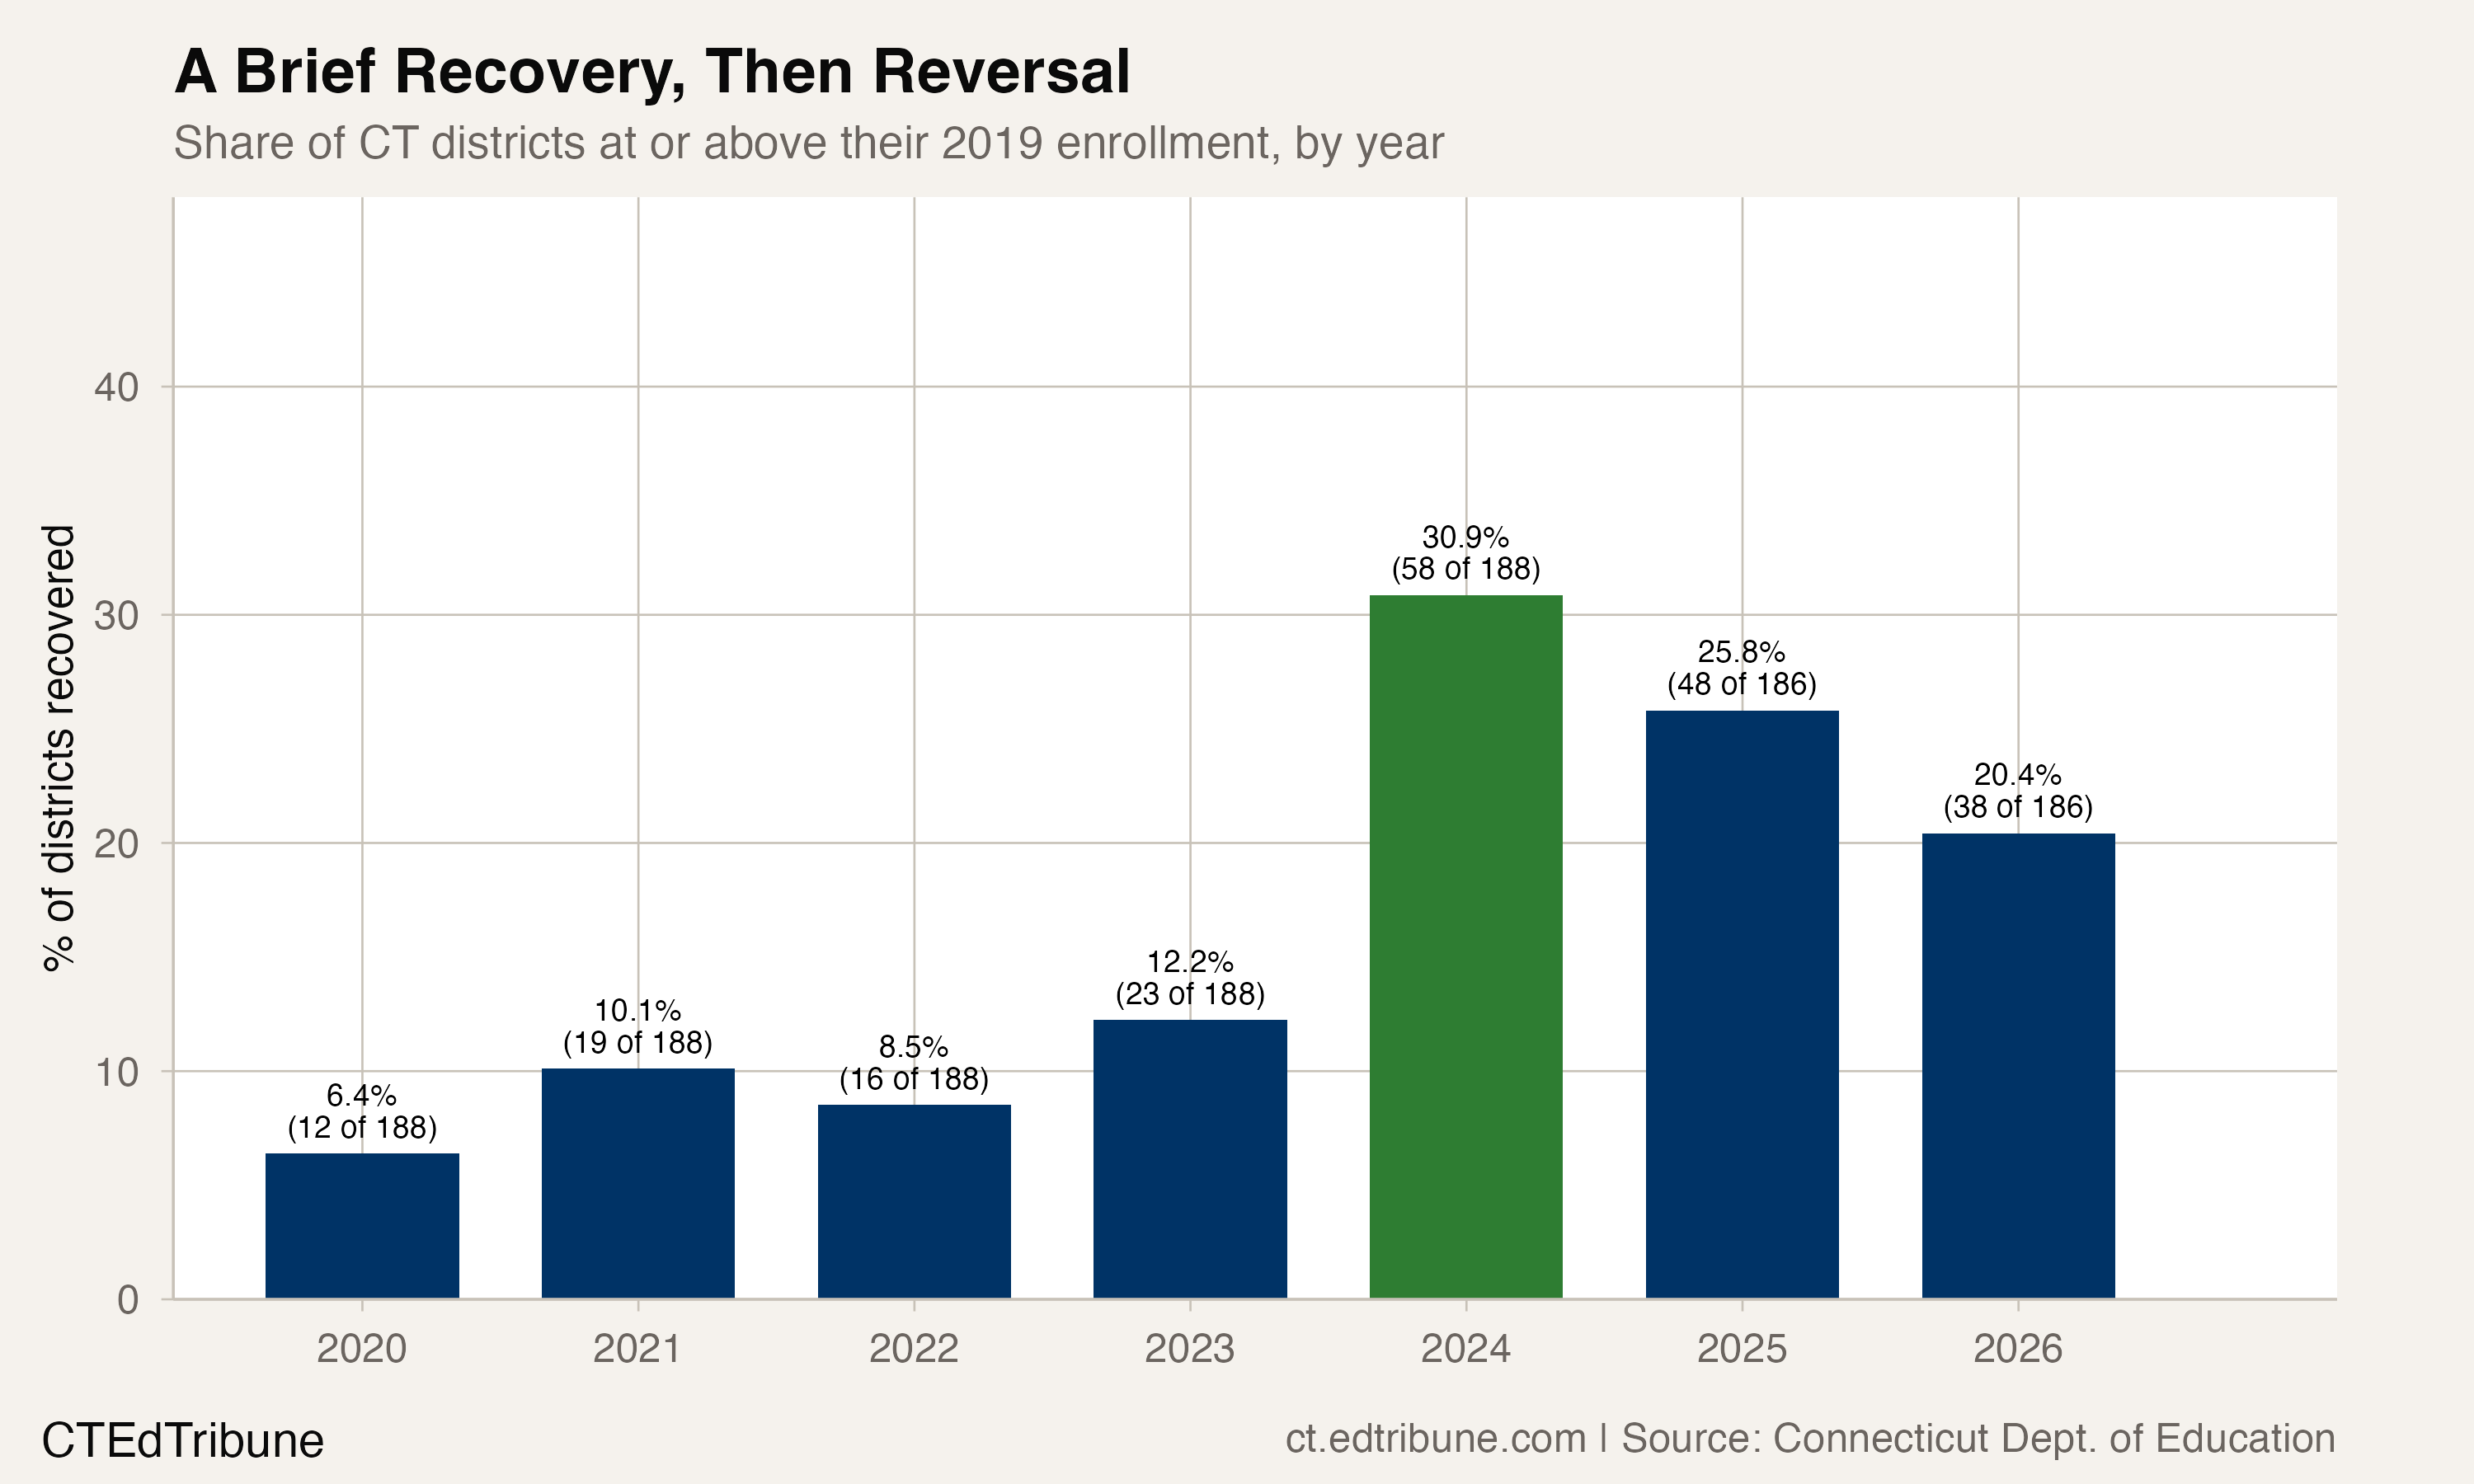
Correction (July 26, 2026): The April correction reached only the statewide narrative. Every district-level count in this article came from the same unreconciled TOTAL enrollment row and has now been recomputed against the EdSight October enrollment census. The recovery universe is 197 districts with 43 recovered (21.8%), not 38 of 186 (20.4%); the yearly recovery rates are 32.5%, 26.9% and 21.8%, not 30.9%, 25.8% and 20.4%; 154 districts are underwater by 38,744 students, not 148 by 37,384; nine districts rather than eight enrolled more than 10,000 in 2019, and one of them, the statewide Connecticut Technical Education and Career System, has grown since; Hartford's 2020 loss was 887 students (4.5%), not 2,423 (12.3%); and the small-district and mid-size recovery counts have been restated. The statewide loss is 32,851 rather than 32,852, and the trendline gap 5,363 rather than 5,367. The article's thesis, that four in five Connecticut districts have not recovered, is unchanged.
After the COVID shock of 2020-21, Connecticut's enrollment briefly plateaued. The state gained 536 students in 2021-22 and lost just 102 in 2022-23. For two years, the trajectory appeared to stabilize.
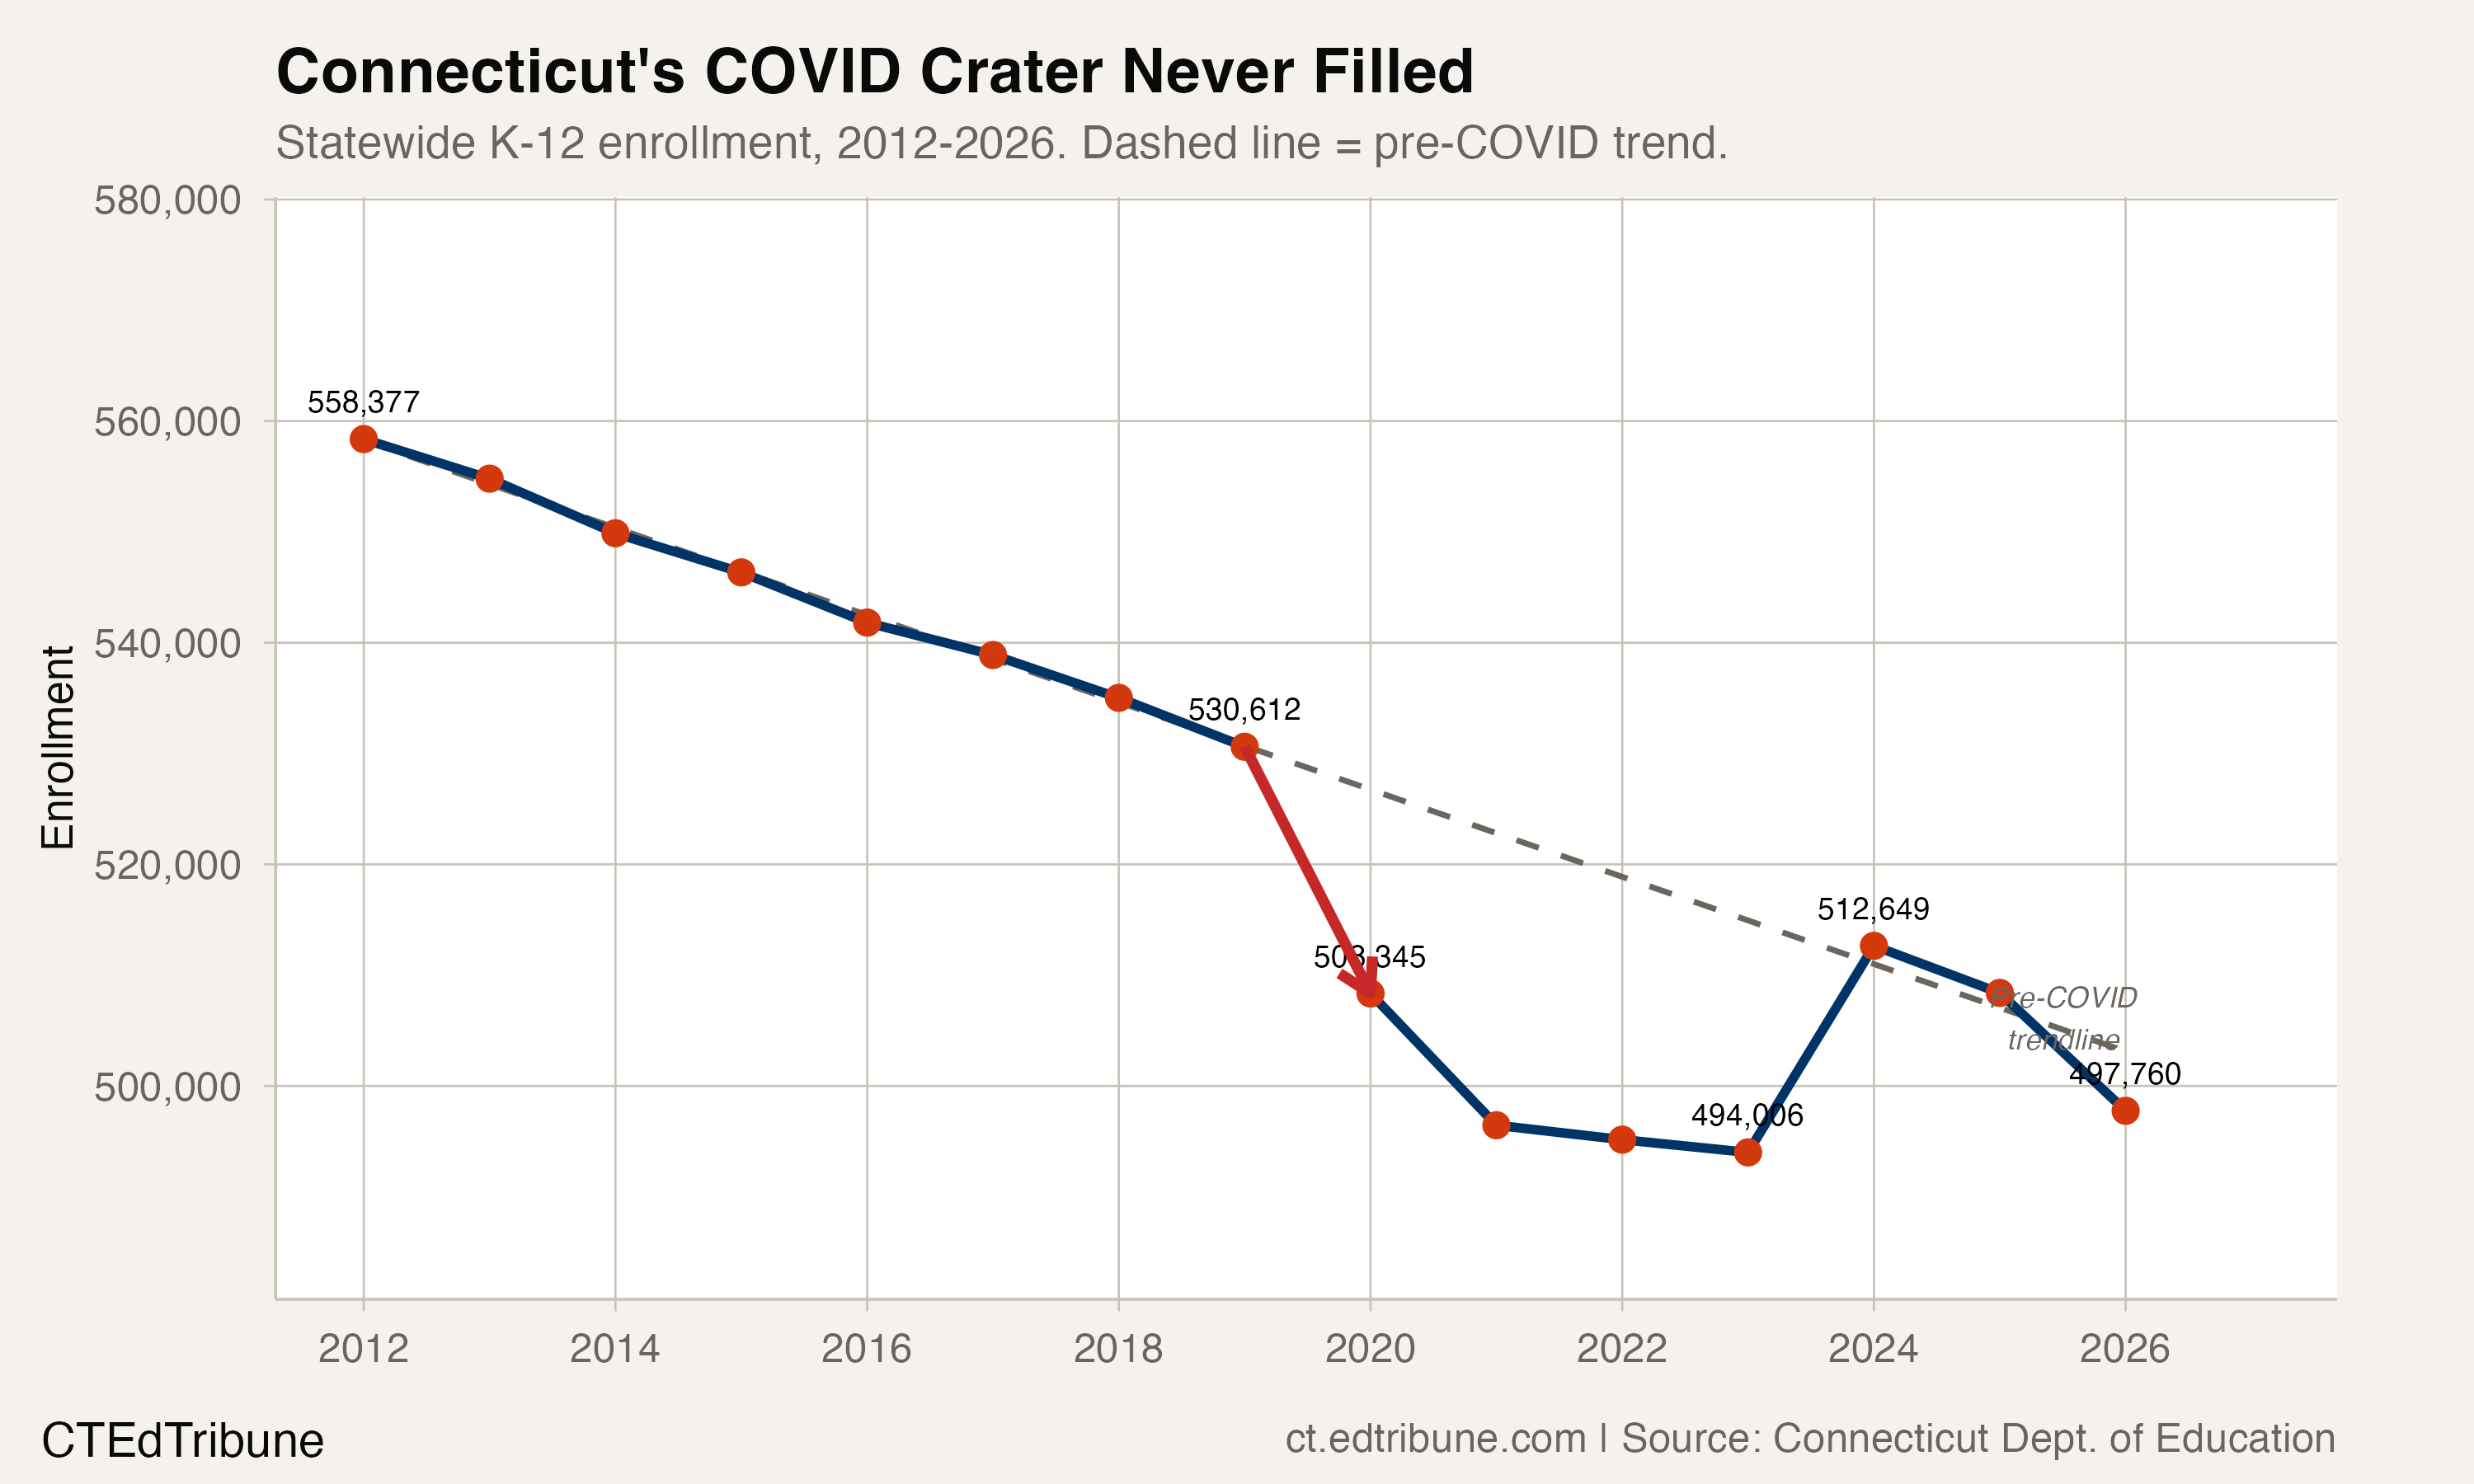
It didn't hold. Enrollment has dropped by 15,853 students since the 2022 plateau peak of 513,613, falling to 497,760 in 2025-26. Only 43 of 197 districts with continuous data, roughly one in five, have returned to their pre-pandemic 2019 enrollment levels. The other 154 are still underwater, collectively missing 38,744 students they had seven years ago.
The false recovery
The post-COVID plateau briefly lifted hopes. By 2024, the share of districts at or above their 2019 levels reached 32.5%, the highest since the pandemic. But the gains evaporated: by 2025, the recovery rate slipped to 26.9%, and by 2026 it fell to 21.8%. In two years, the state gave back a third of the ground it had regained.
The pattern suggests that the 2022-2024 plateau was a pause, not a recovery, layered on top of a structural decline that never ended. Connecticut was already losing roughly 4,000 students per year before COVID. The pandemic accelerated that trajectory, and the near-flat years that followed did not reset it.
The state is now 32,851 students below its 2019 level, a 6.2% decline. Against the pre-COVID trendline, which was itself declining, Connecticut sits 5,363 students below where even that pessimistic projection predicted it would be. COVID did not merely accelerate an existing decline. It created a permanent downward shift.
Not one large city district recovered
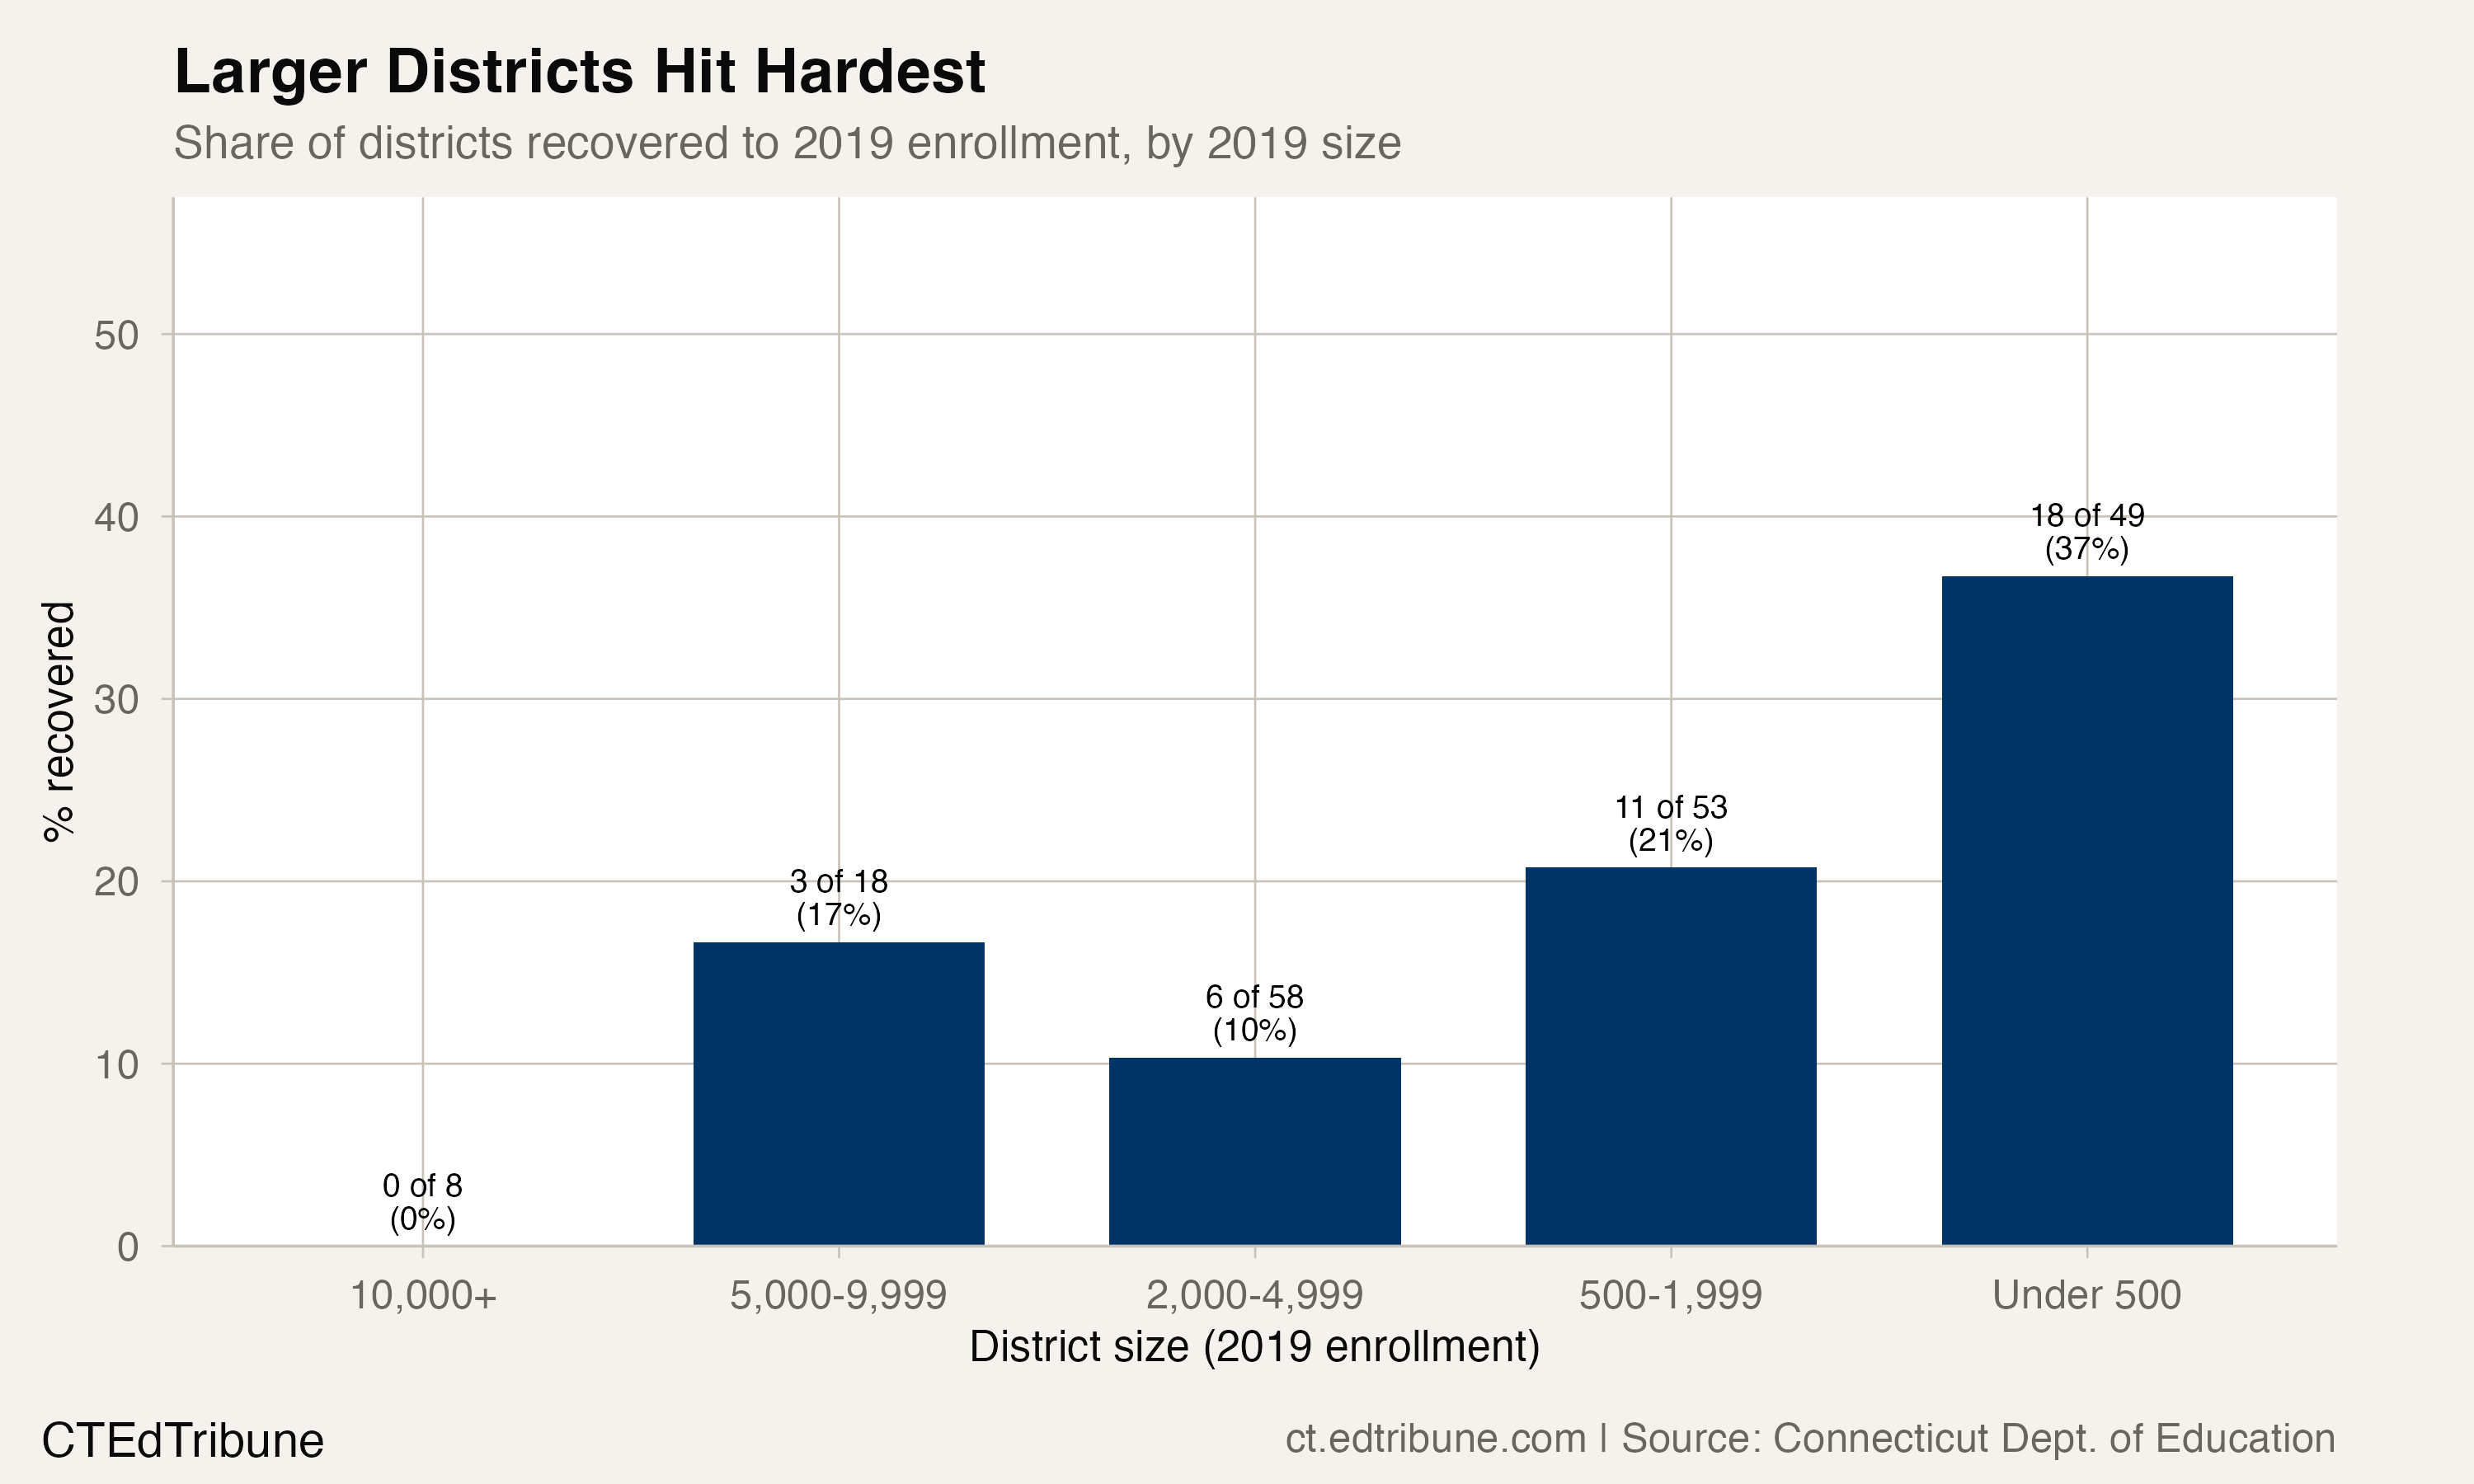
The relationship between district size and recovery is stark. Nine Connecticut districts enrolled more than 10,000 students in 2019. Only one is larger today, and it is not a city: the Connecticut Technical Education and Career System, the statewide technical high school network, grew from 10,647 to 11,612. Every one of the eight geographic districts on that list, the state's largest school systems, was smaller in 2025-26 than before the pandemic.
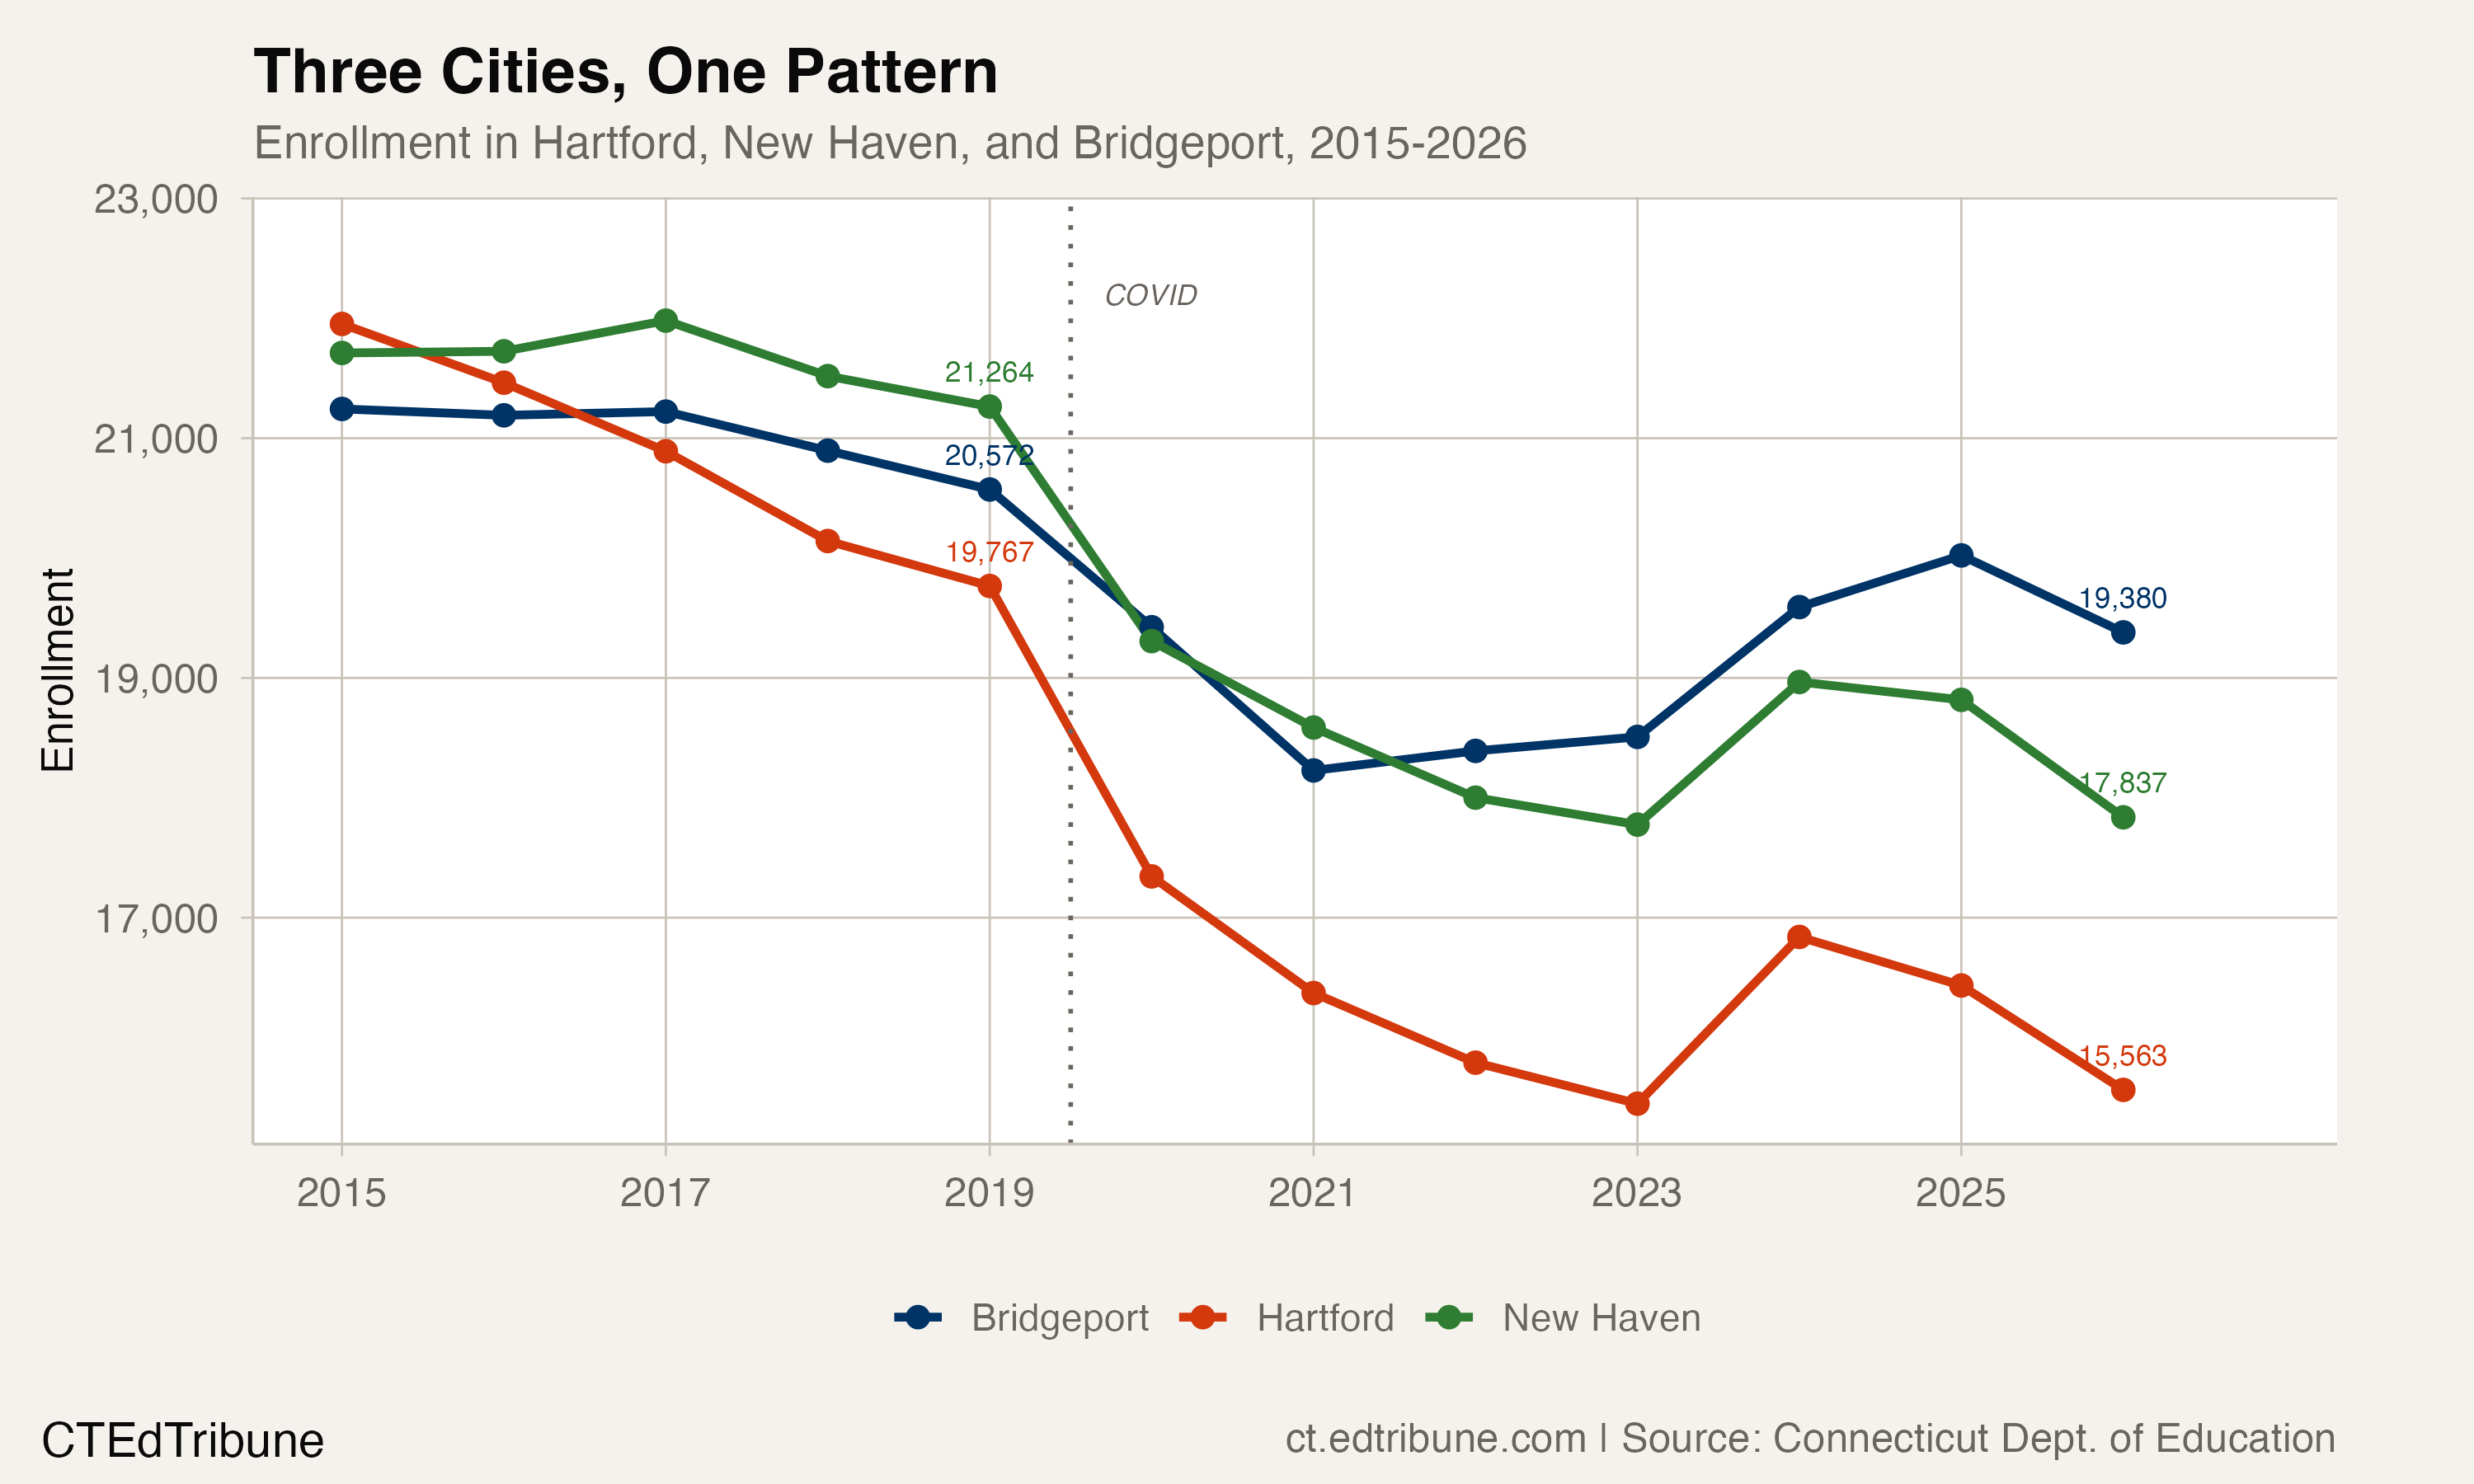
Hartford↗ET suffered the worst absolute loss: 4,204 fewer students, a 21.3% decline, dropping from 19,767 to 15,563. New Haven↗ET lost 3,427 students (16.1%). Bridgeport↗ET, the state's current largest district, lost 1,192 (5.8%). Together, those three cities account for 8,823 of the state's 32,851 missing students, more than a quarter of the total.
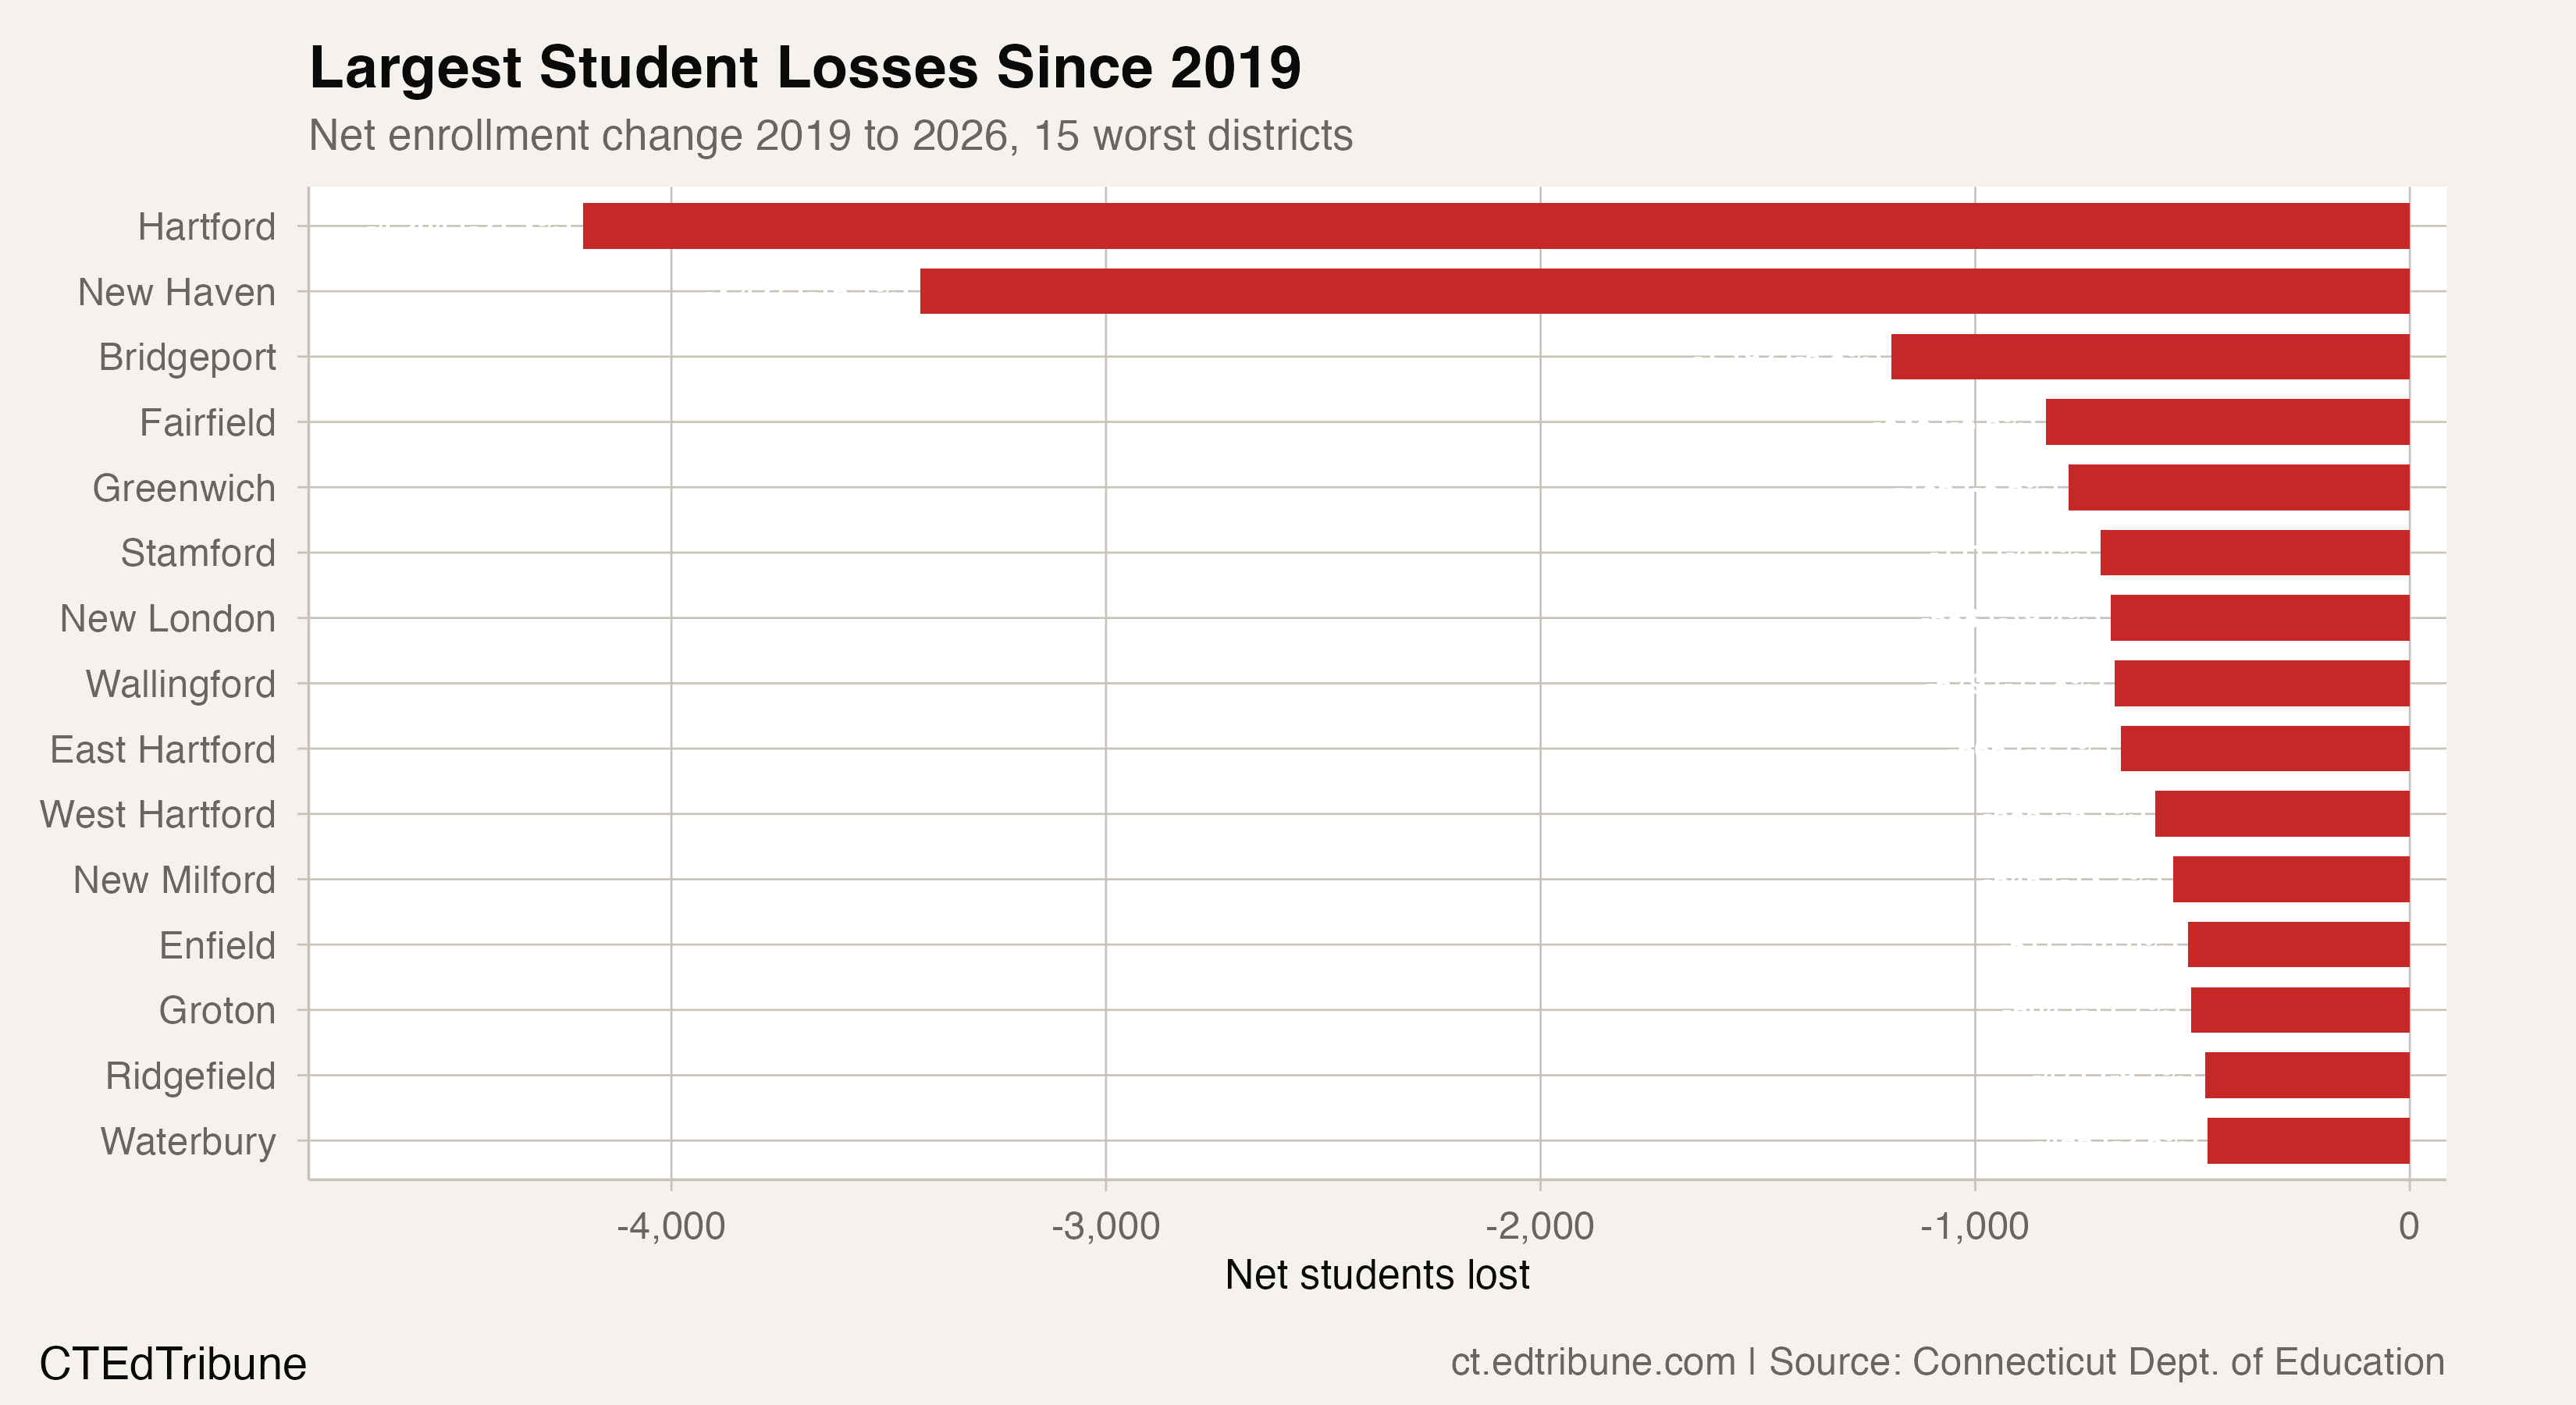
The losses extend well beyond the cities. Fairfield↗ET, an affluent suburb, lost 838 students (8.5%). Greenwich↗ET lost 786 (8.6%). East Hartford↗ET, a working-class suburb, lost 665 (9.7%). Enrollment loss in Connecticut is not confined to urban districts with high poverty rates. It cuts across wealth, geography, and demographics.
Among mid-size districts (5,000 to 9,999 students), only three of 18 recovered (16.7%). In the 2,000 to 4,999 range, six of 59 (10.2%). The only size category where recovery is common is among districts under 500 students, where 21 of 56 (37.5%) have regained their 2019 levels. Small districts have small absolute losses, and a handful of new families can erase a deficit.
Hartford's compounding crisis
Hartford's trajectory illustrates how COVID losses compound existing problems. The district was already declining before the pandemic, dropping from 21,952 students in 2015 to 19,767 in 2019. Then COVID hit: enrollment fell to 18,880 in 2020, a single-year loss of 887 students (4.5%), and to 17,733 the year after, for a two-year loss of 2,034. The slide paused once, in 2024, when the district added 65 students to reach 16,839. It resumed immediately, ending 2026 at 15,563.
That 21.3% decline since 2019 comes on top of a $45 million budget deficit and the loss of over $152 million in federal ESSER pandemic relief funds that expired in September 2024. Hartford received one of the largest ESSER allocations in the state, money that funded tutors, mental health professionals, and summer programs. Those positions are now among the first being cut.
New Haven↗ET faces a parallel trajectory: down from 21,264 to 17,837, a loss of 3,427 students. In 2017, New Haven briefly enrolled more students than Hartford. In 2025-26, both were well below Bridgeport, which at 19,380 had become the state's largest district despite its own 5.8% decline.
Where the students went
Connecticut does not require homeschooling families to report to the state, making a full accounting of the missing students impossible. What limited data exists suggests homeschooling is not the primary explanation. The rate of students transferring to homeschool has actually declined slightly, from 0.4% in 2021-22 to 0.3% in 2023-24, and roughly 2.5% of Connecticut's K-12 students are homeschooled.
Private school enrollment has grown modestly, from about 50,500 in 2020-21 to 53,000 in 2024-25, but that gain of 2,500 students accounts for only a fraction of the 32,851 missing from public schools. Connecticut's birth rate, which ranked 49th among states as recently as 2015, is the most likely structural driver. Fewer children are being born, and fewer families are moving in to replace the ones aging out.
"The only other year of decline was during the COVID year, when in October there was a greater percentage decline." -- Ajit Gopalakrishnan, State Education Department Chief Performance Officer, WSHU, Feb. 2026
Gopalakrishnan's comparison is instructive: the 2025-26 decline of 2.1%, or roughly 10,640 students, is the largest single-year drop since 2020-21. It is not another COVID. It is the return of structural decline after a brief reprieve.
The charter exception
Among the 38 districts that have recovered, a striking pattern emerges. Charter-like entities, including charter schools and magnet school operators, account for 13 of the 38 recoveries, despite representing only 17 of 186 districts in the dataset. Their recovery rate is 76.5%, compared to 14.8% for traditional districts.
The Capitol Region Education Council, which operates interdistrict magnet schools under Connecticut's Sheff v. O'Neill desegregation framework, grew from 8,672 to 9,118 students. Meriden↗ET, a traditional district, is the notable exception among larger recoveries, gaining 408 students (5.1%). South Windsor↗ET is the single standout: it has grown every year since 2017, adding 783 students (17.9%) since 2019, a nine-year streak that makes it an extreme outlier in a state where sustained growth barely exists.
The hold-harmless cushion
For now, the fiscal consequences of enrollment decline are partially buffered. Connecticut's Education Cost Sharing formula, which distributes approximately $2.46 billion annually, reached full funding for the first time in state history in fiscal year 2026. A hold-harmless provision, in place since FY 2022, prevents districts from losing state funding even as enrollment drops. Without it, districts would collectively lose more than $200 million.
That protection expires after FY 2027. When it does, districts that have been spending as though enrollment would recover will face a reckoning. The ECS formula is designed to phase out overfunding through FY 2034, but legislators have delayed that phase-out three times already.
The question is whether Connecticut's enrollment decline will have stabilized by then, or whether districts will be trying to absorb funding cuts while still losing students. For the smallest districts, the timeline may not matter. New London↗ET lost 688 students since 2019, a 19.4% decline. Norfolk lost 42.7% of its enrollment. Regional School District 04 lost 33.7%. At that pace, hold-harmless or not, the enrollment base may be too thin to sustain current operations.
Connecticut lost 32,851 public school students in seven years. The post-COVID plateau from 2022 to 2024 briefly slowed the bleeding, but the 2025-26 cliff erased any illusion of stabilization. The state has now lost 15,853 students since its post-COVID peak, and the pace is accelerating.
Detailed code that reproduces the analysis and figures in this article is available exclusively to EdTribune subscribers.
Discussion
Sign in to join the discussion.
Loading comments...