Connecticut lost 66,739 students between 2010-11 and 2025-26, an 11.8% decline that touched 163 of the state's 184 districts. Danbury↗ET gained 756.
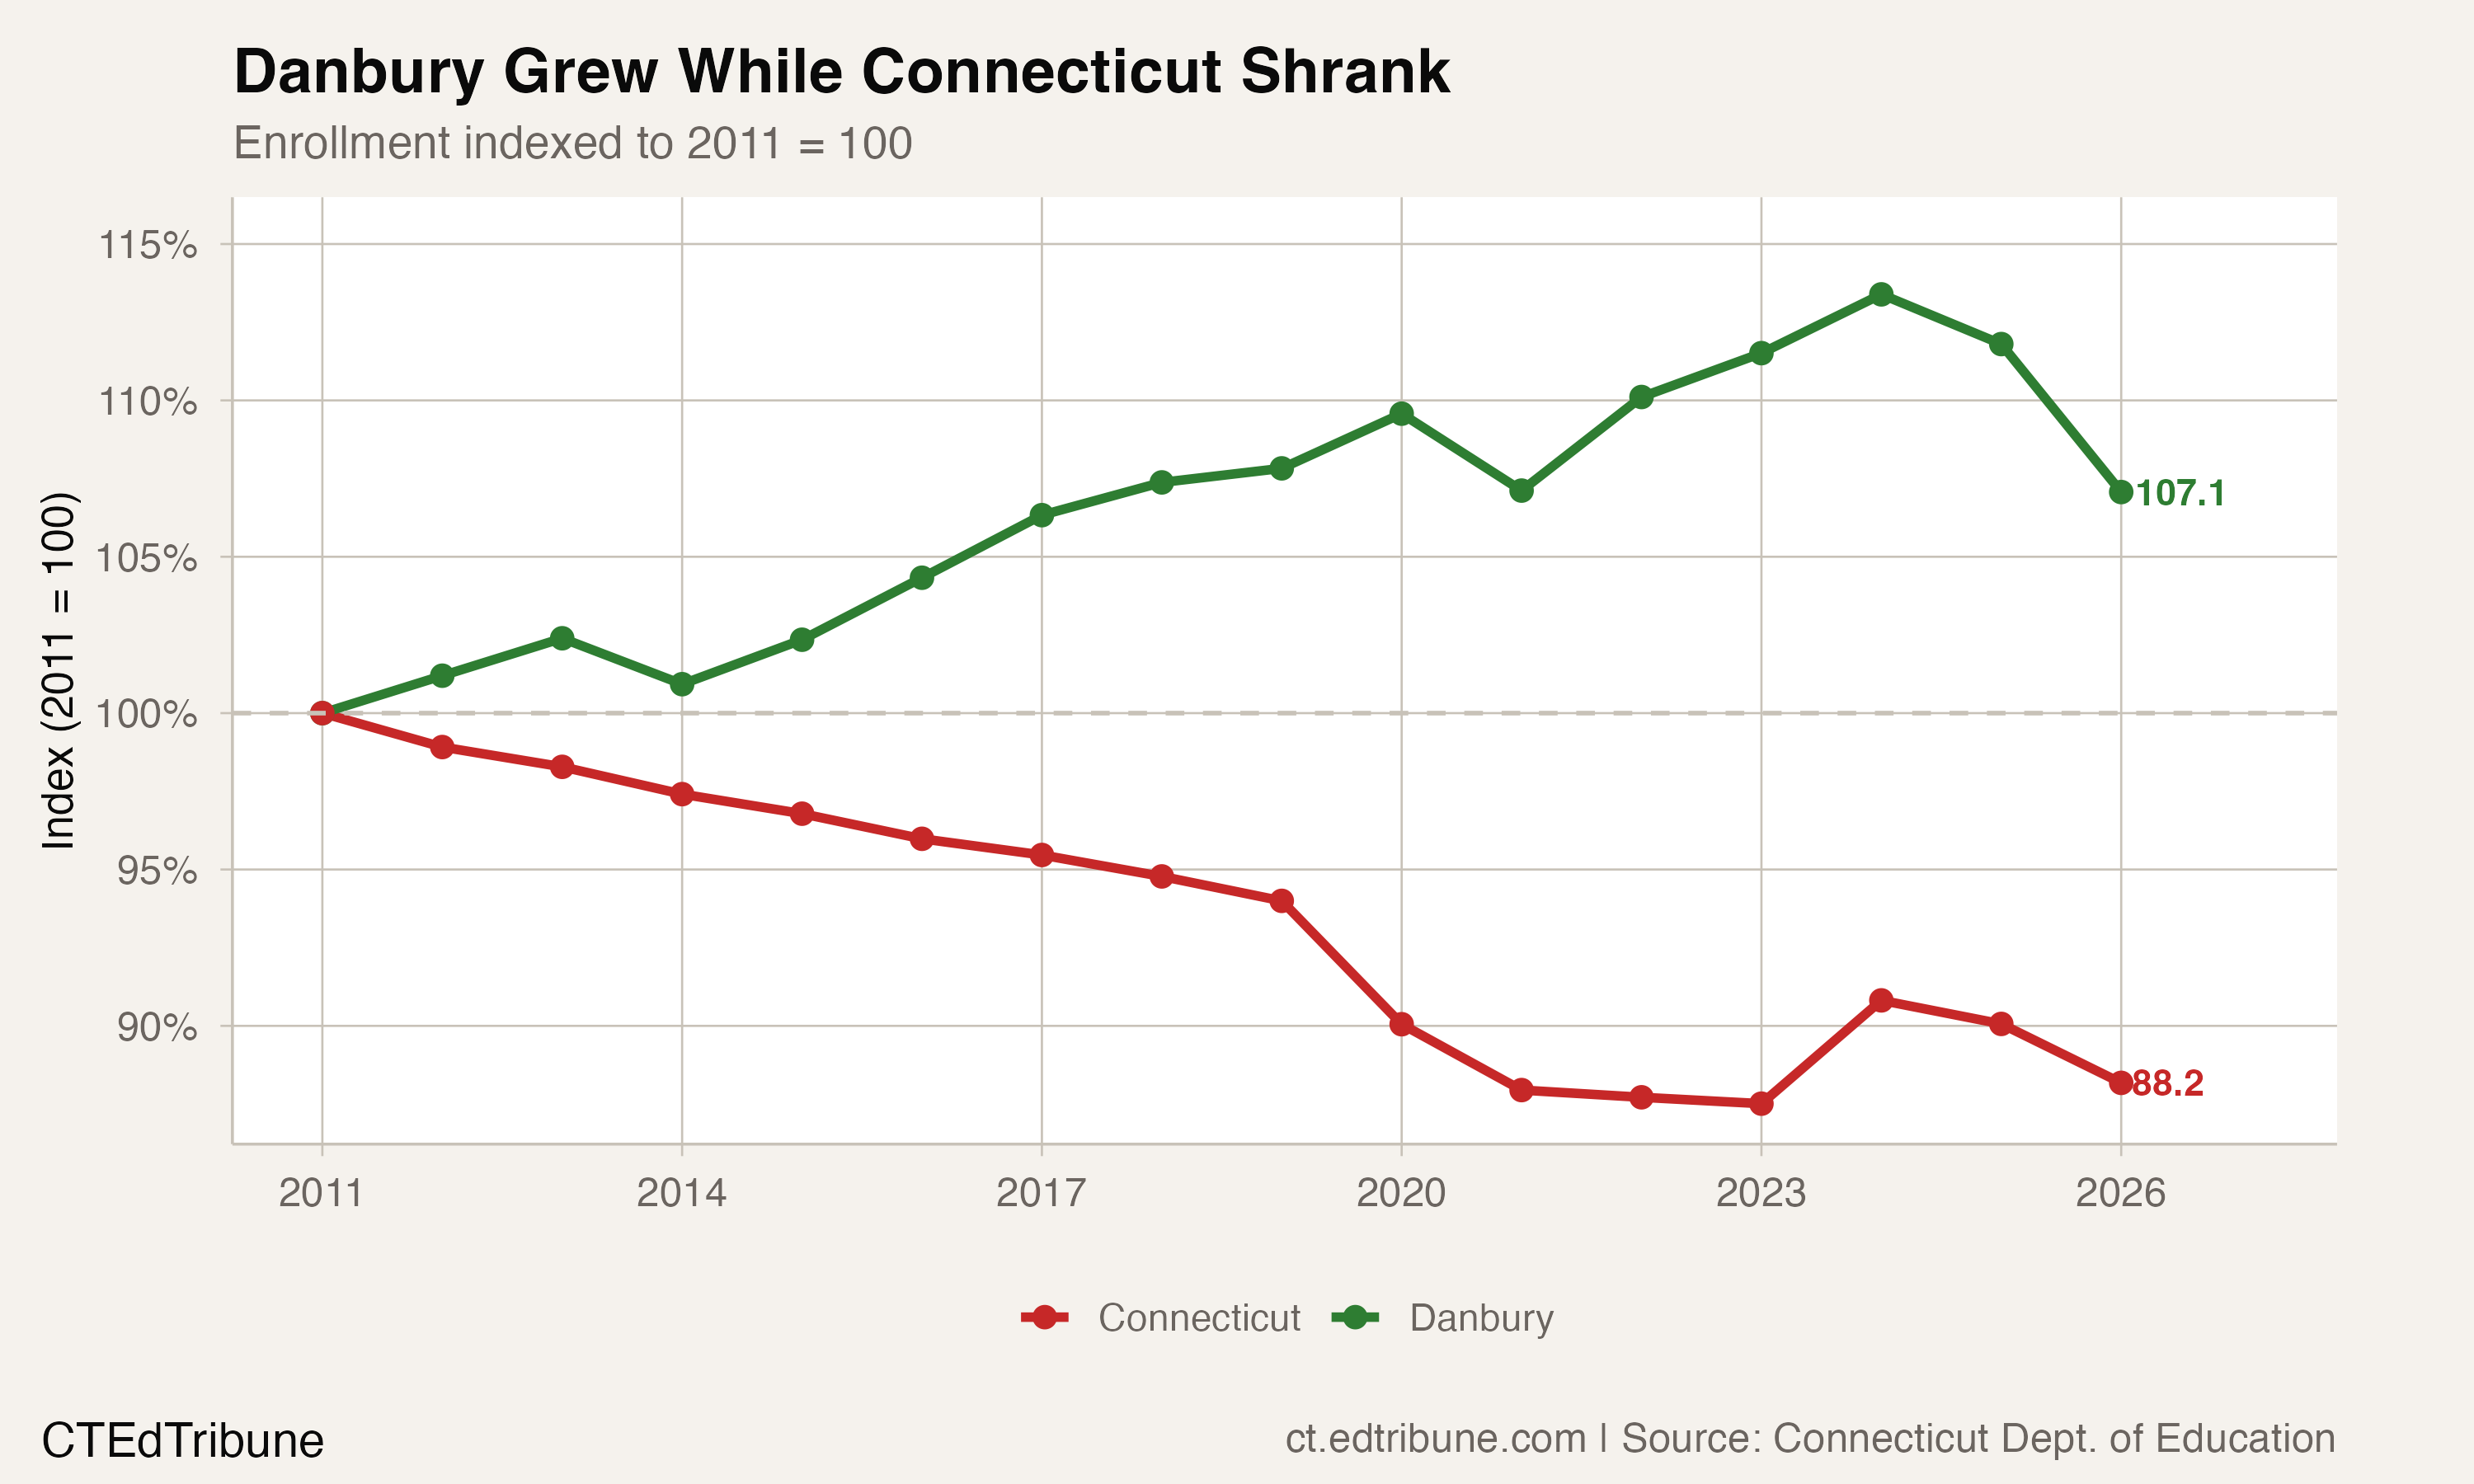
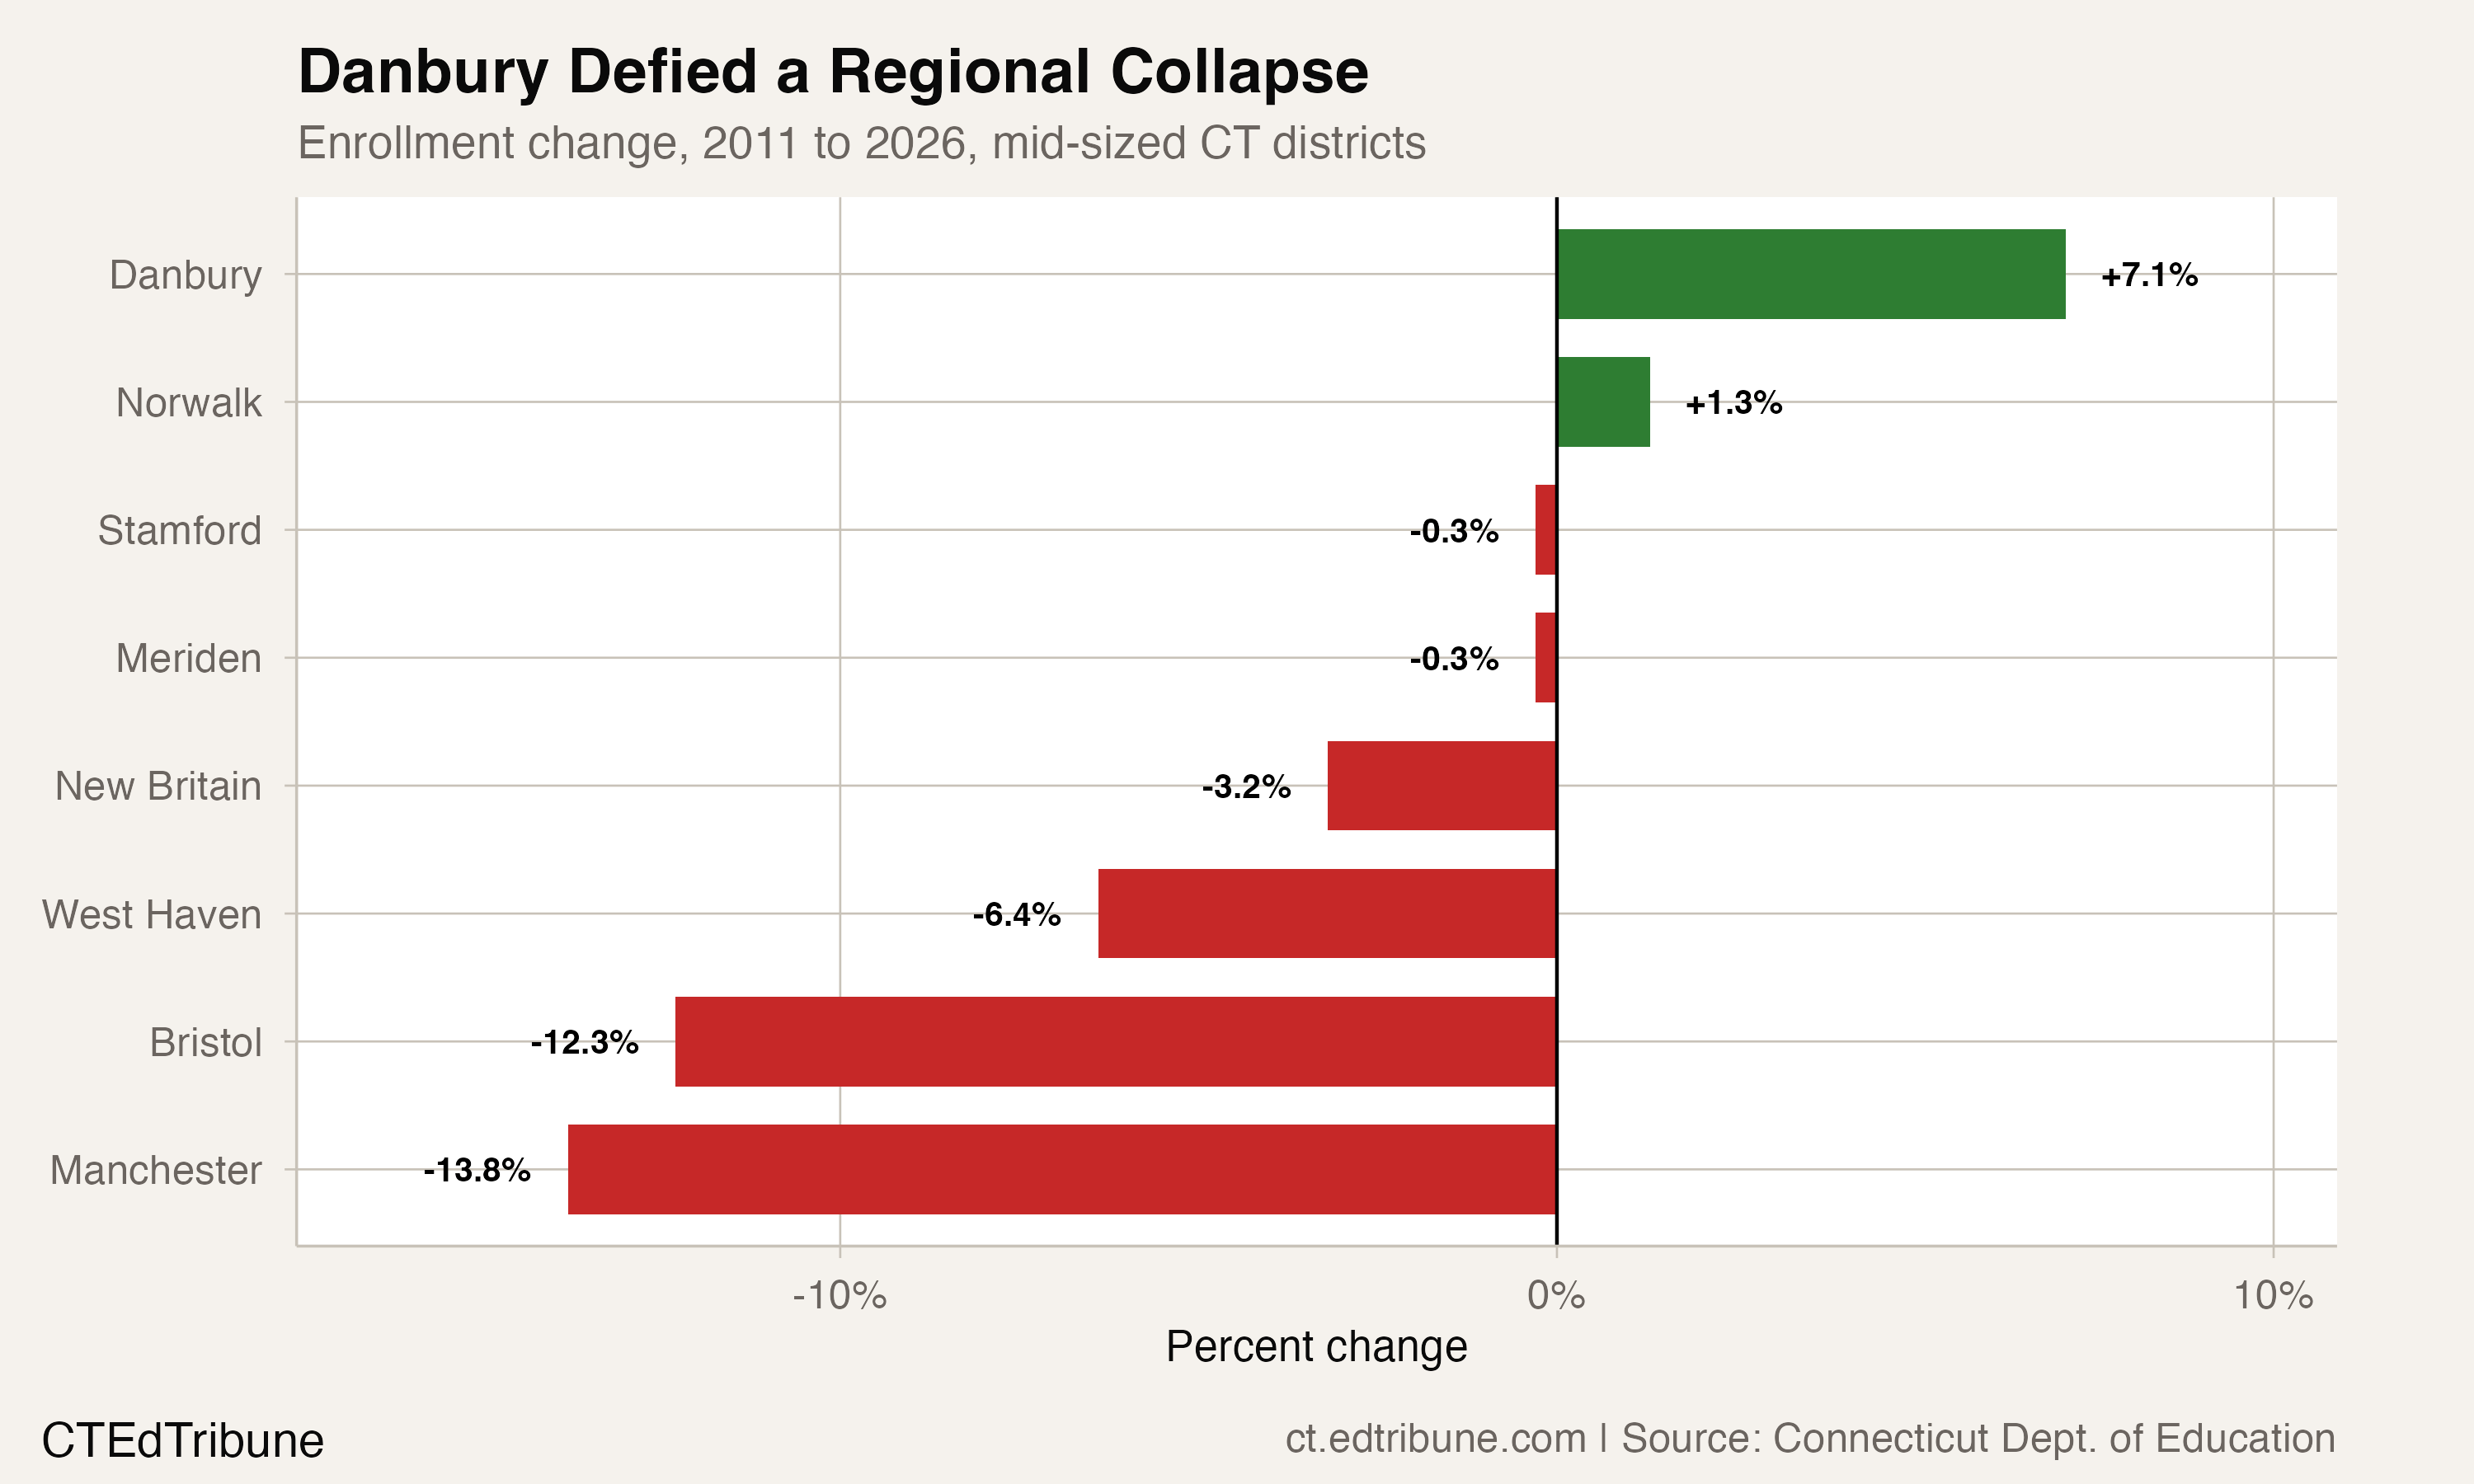
That makes Danbury the largest traditional school district in Connecticut to grow over this period, adding students at a 7.1% clip while peers like Bristol (-12.3%) and Manchester (-13.8%) contracted by double digits. The growth engine is straightforward: immigration, primarily from Ecuador, Brazil, and the Dominican Republic, fed a student body that is now two-thirds Hispanic and more than one-third English learners. No other district in Connecticut has a higher concentration of students classified as English learners than Danbury's 36.5%.
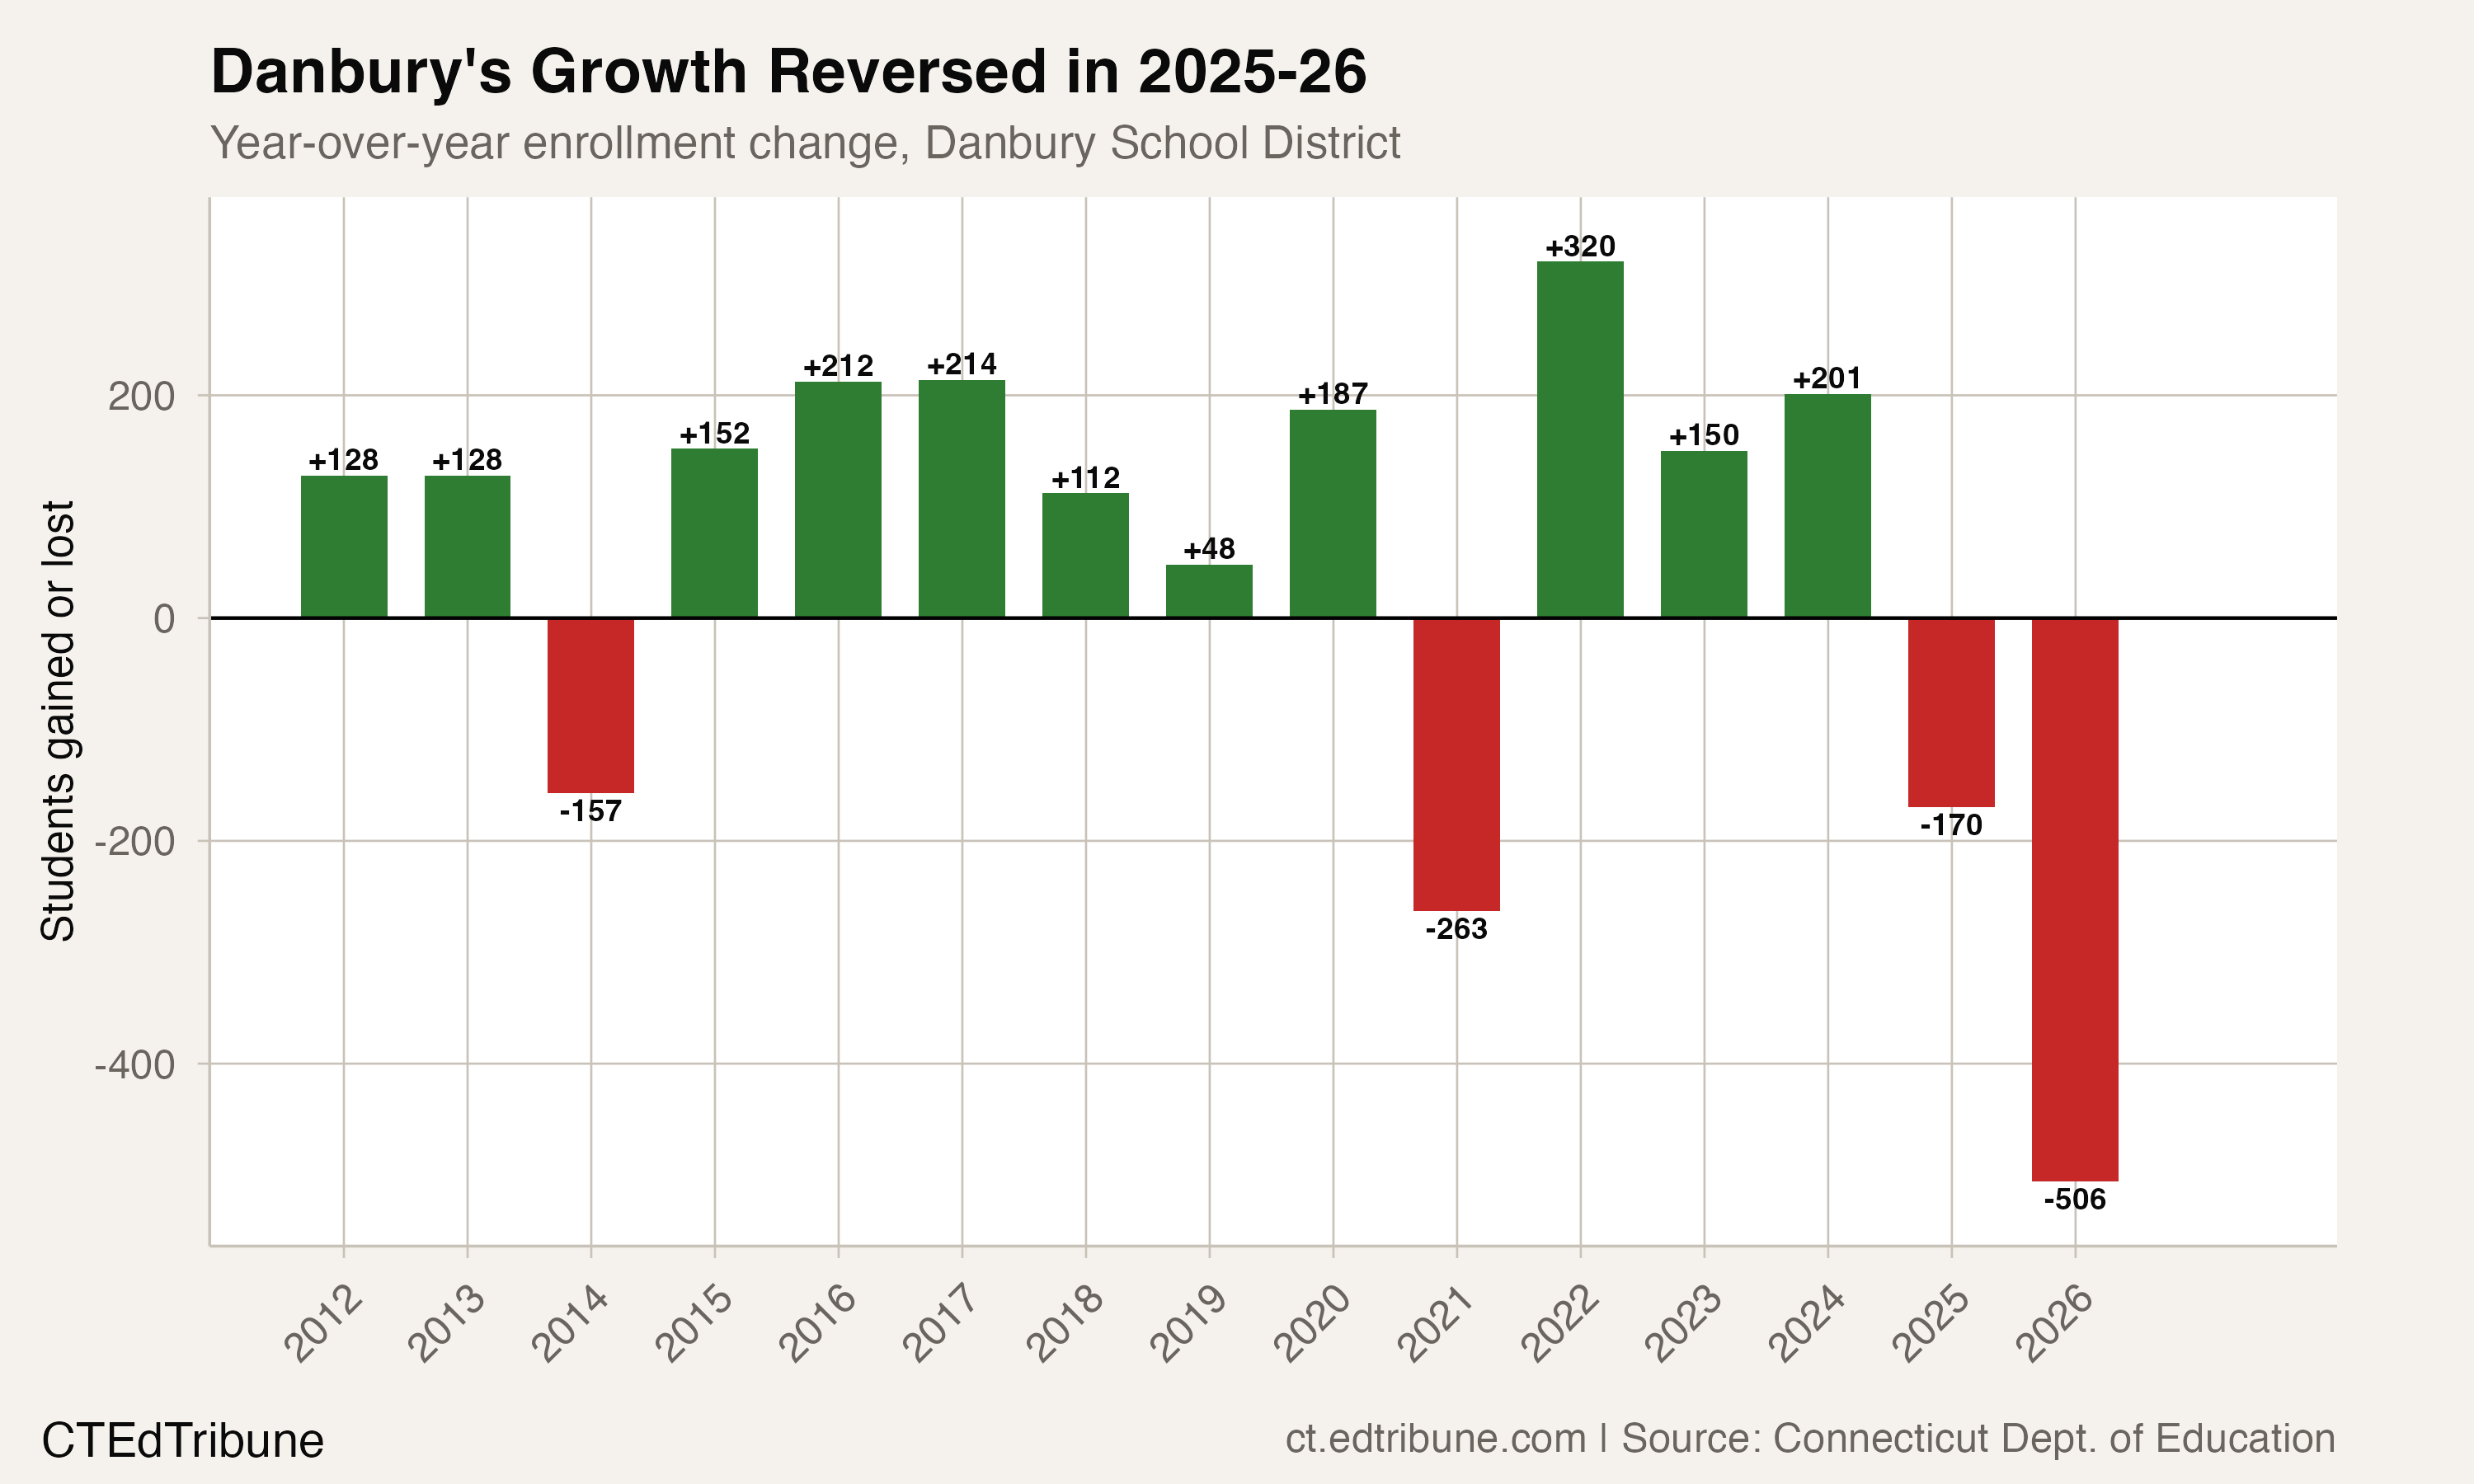
The 2025-26 school year, though, delivered a jolt. Danbury lost 506 students, its largest single-year decline in the dataset and a sharper reversal than anything COVID produced. The drop coincides with a statewide decline in English learner enrollment that advocates have linked to immigration enforcement fears. Whether the dip is a one-year interruption or the beginning of a new trajectory will shape budget and staffing decisions across the district.
The only large district swimming upstream
Among Connecticut districts enrolling more than 1,000 students in 2011, exactly six grew by 2026. The Capitol Region Education Council, a magnet school consortium, added 4,472 students. Danbury added 756. South Windsor added 554. After that, the gains shrink to the low hundreds: Waterbury (+193), Bethel (+176), Norwalk (+149). Every other large district in the state lost students.
Danbury's trajectory is unusual in its steadiness. From 2011 to 2024, the district posted positive enrollment in 11 of 13 years, including a 187-student gain during the initial COVID disruption in 2019-20. The two exceptions were 2013-14 (-157) and 2020-21 (-263, the delayed COVID effect), both of which reversed the following year. By 2023-24, enrollment peaked at 12,126, making Danbury Connecticut's sixth-largest district.
Remove Danbury from the state totals and Connecticut's 15-year decline deepens from 11.8% to 12.2%. That is a modest difference in percentage terms, but it illustrates the arithmetic: Danbury's 756-student gain offset nearly all of Norwalk's 149-student gain, and the rest of the state's losses swallowed everything else.
A demographic transformation in 15 years
The enrollment growth is inseparable from the demographic shift underneath it. In 2010-11, Danbury's students were 44.7% white and 37.2% Hispanic. By 2025-26, those numbers had inverted: 66.7% Hispanic, 19.0% white. Hispanic enrollment nearly doubled, rising from 3,983 to 7,641 students, while white enrollment fell by more than half, from 4,782 to 2,172. The crossover came in 2018-19, when Hispanic students first exceeded 50% of enrollment.

Danbury is now the third-most-Hispanic district in Connecticut by share, trailing only Windham (72.0%) and New Britain (68.3%). But Windham enrolls 3,058 students and New Britain enrolls 9,897. Danbury is the largest district in that tier, meaning it absorbs the highest absolute number of newly arriving Spanish-speaking families in western Connecticut.
The city's demographics explain why. About 35% of Danbury's residents were born outside the United States, more than double the national average, with the largest groups from Ecuador, Brazil, and the Dominican Republic. Ecuadorian families began settling in Danbury in the 1980s and 1990s, drawn by lower housing costs than the New York City metro and word-of-mouth networks. The pattern has been self-reinforcing: each arriving family creates social infrastructure that draws the next.
Connecticut's highest English learner concentration
Separately from the racial composition, Danbury's English learner population has grown even faster than its Hispanic enrollment, rising from 1,980 students (18.5% of enrollment) in 2011 to 4,184 (36.5%) in 2026, an increase of 111.3%. That rate is more than triple the statewide English learner share of 11.1%.
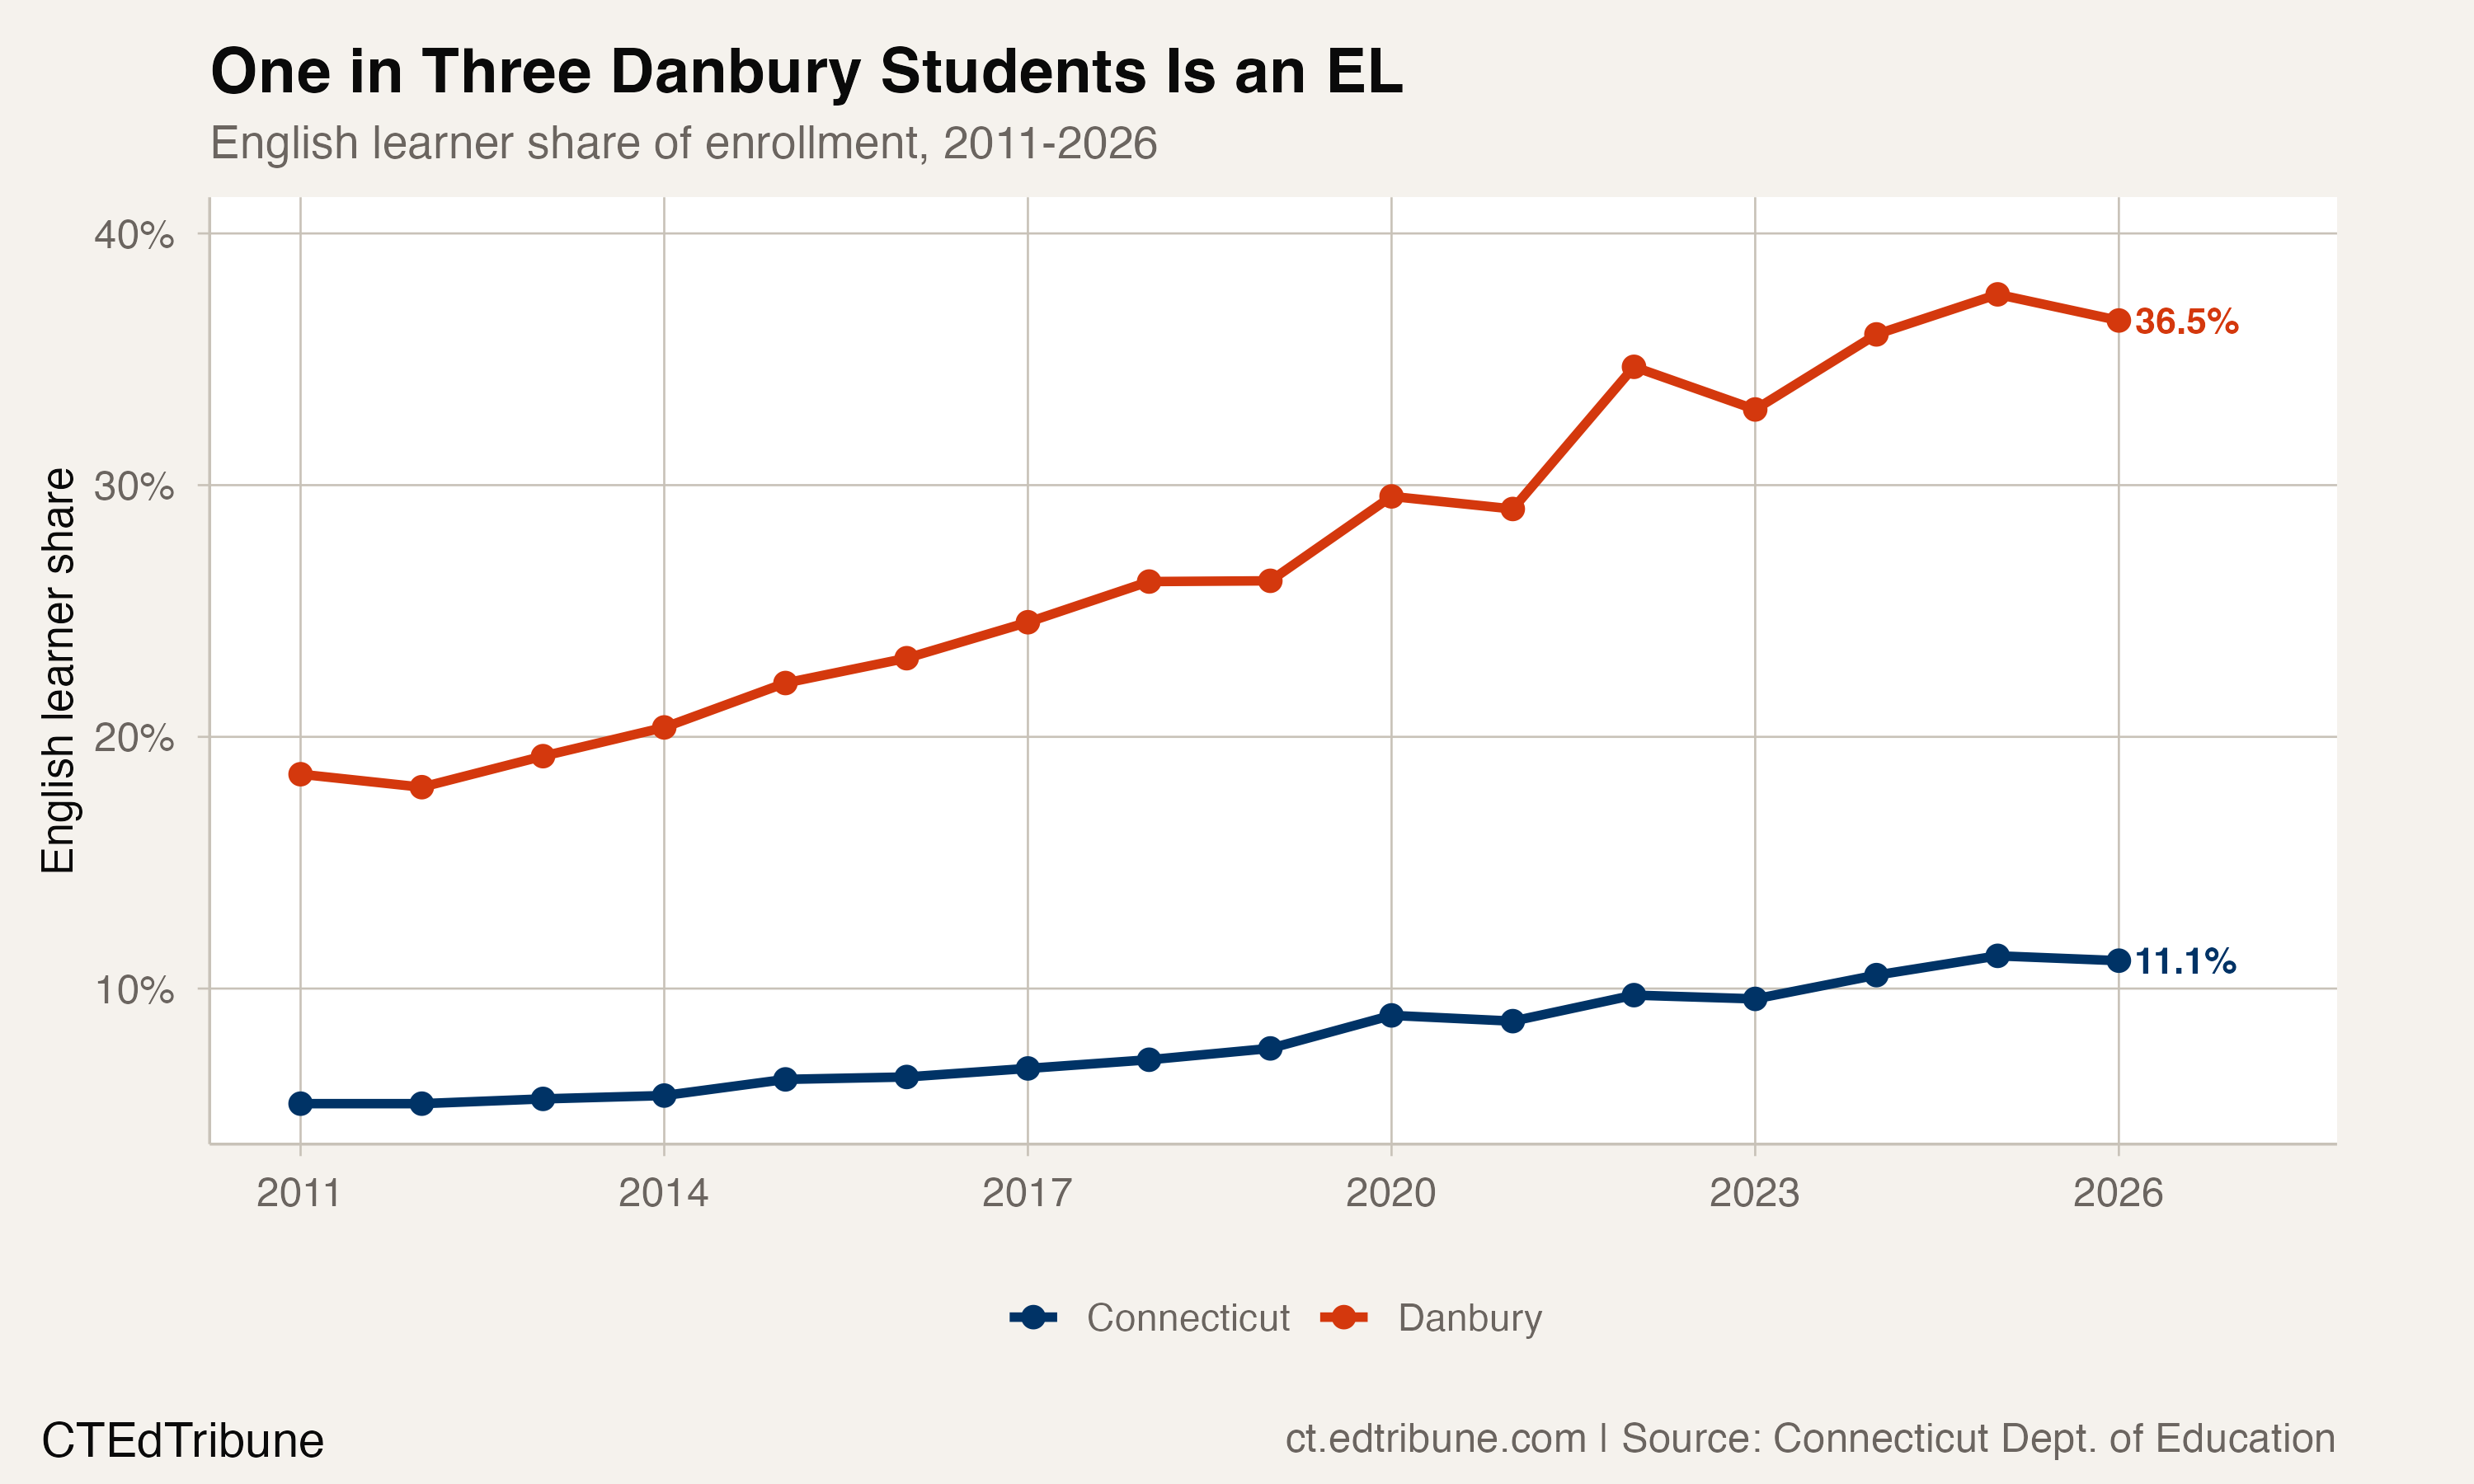
The EL-to-Hispanic ratio has held roughly stable over 15 years, fluctuating between 46% and 59%. In other words, about half of Danbury's Hispanic students are classified as English learners at any given time. This consistency suggests the growth is driven primarily by new arrivals rather than reclassification of existing students. When identification criteria shift, the ratio moves; when families move in, both counts rise together.
That concentration creates operational pressure. Danbury's deputy superintendent told New America in 2014 that the district had been "out of state compliance for many years given the shortage of certified ELL teachers." A decade later, the shortage persists. In January 2024, the district requested a nearly 20% budget increase, driven in part by the need for 14 additional bilingual teachers, paraeducators, and coaches as federal COVID relief funds expired.
The 2025-26 reversal
After more than a decade of near-continuous growth, Danbury lost 506 students in 2025-26, falling from 11,956 to 11,450. The loss erased two full years of gains.
The decline hit English learners and Hispanic students disproportionately. Danbury's EL count fell by 309 students, from 4,493 to 4,184. Hispanic enrollment dropped by 256, from 7,897 to 7,641. The EL decline in Danbury was part of a broader statewide pattern: Connecticut's total English learner enrollment fell from 57,447 to 55,290, a decline of 2,157 students and the largest single-year EL drop since 2021.
Advocates have pointed to immigration enforcement as a likely factor. In August 2025, ICE arrested 65 people in Connecticut, prompting Danbury Superintendent Kara Quinn Casimiro to express concern about attendance:
"Naturally, we're concerned about not just the physical safety of our students and our families, but in particular, the psychological safety of students and what they need to feel to be successful." -- Connecticut Public, Aug. 2025
New Haven Superintendent Madeline Negron, whose district experienced a similar EL enrollment decline, described the mechanism more bluntly:
"When the federal government signals that it can bypass the courts to conduct arrests in community spaces, it creates a profound chilling effect. Parents who are unsure of the legal nuances may choose what they perceive as the safest option: keeping their children home." -- New Haven Independent, Mar. 2026
Whether the enrollment drop reflects families leaving the district, families keeping children home, or families relocating out of Connecticut entirely is not visible in the enrollment counts alone. Kindergarten enrollment in Danbury also fell sharply, from 841 in 2011 to 713 in 2026, a 15.2% decline that mirrors the statewide kindergarten contraction. That drop likely reflects birth rate declines as much as immigration patterns, making it harder to isolate a single cause for the overall 2025-26 loss.
What Danbury reveals about Connecticut
Danbury is not a microcosm of Connecticut. It is the exception that proves the rule. Strip away the immigration-driven growth and the state's enrollment picture is uniformly bleak: 163 of 184 districts declining, a statewide loss approaching 67,000 students, and no sign of a floor.
A one-year decline of 506 students, while notable, does not erase a 15-year gain of 1,432 students from trough to peak. If enforcement pressure eases and families re-enroll, the 2025-26 dip may look like an anomaly. If it accelerates, Danbury joins the rest of Connecticut.
For a district that requested a 20% budget increase in 2024, the stakes are concrete. Bilingual staffing, classroom capacity, and per-pupil funding all depend on whether next October's enrollment count recovers or declines further. Danbury built its school system around growth. Connecticut's other districts know what it looks like when that growth stops.
Detailed code that reproduces the analysis and figures in this article is available exclusively to EdTribune subscribers.
Discussion
Sign in to join the discussion.
Loading comments...