In this series: Connecticut 2025-26 Enrollment.
In 2011, Ansonia↗ET was barely on the line. White students made up 51.9% of the district's enrollment, a slim majority in a small city wedged between New Haven and Derby along the Naugatuck River. By 2026, white students account for 21.5% of Ansonia's enrollment. The threshold Ansonia crossed in 2013 has since been crossed by a dozen more Connecticut districts, many of them places that looked nothing like Ansonia 15 years ago.
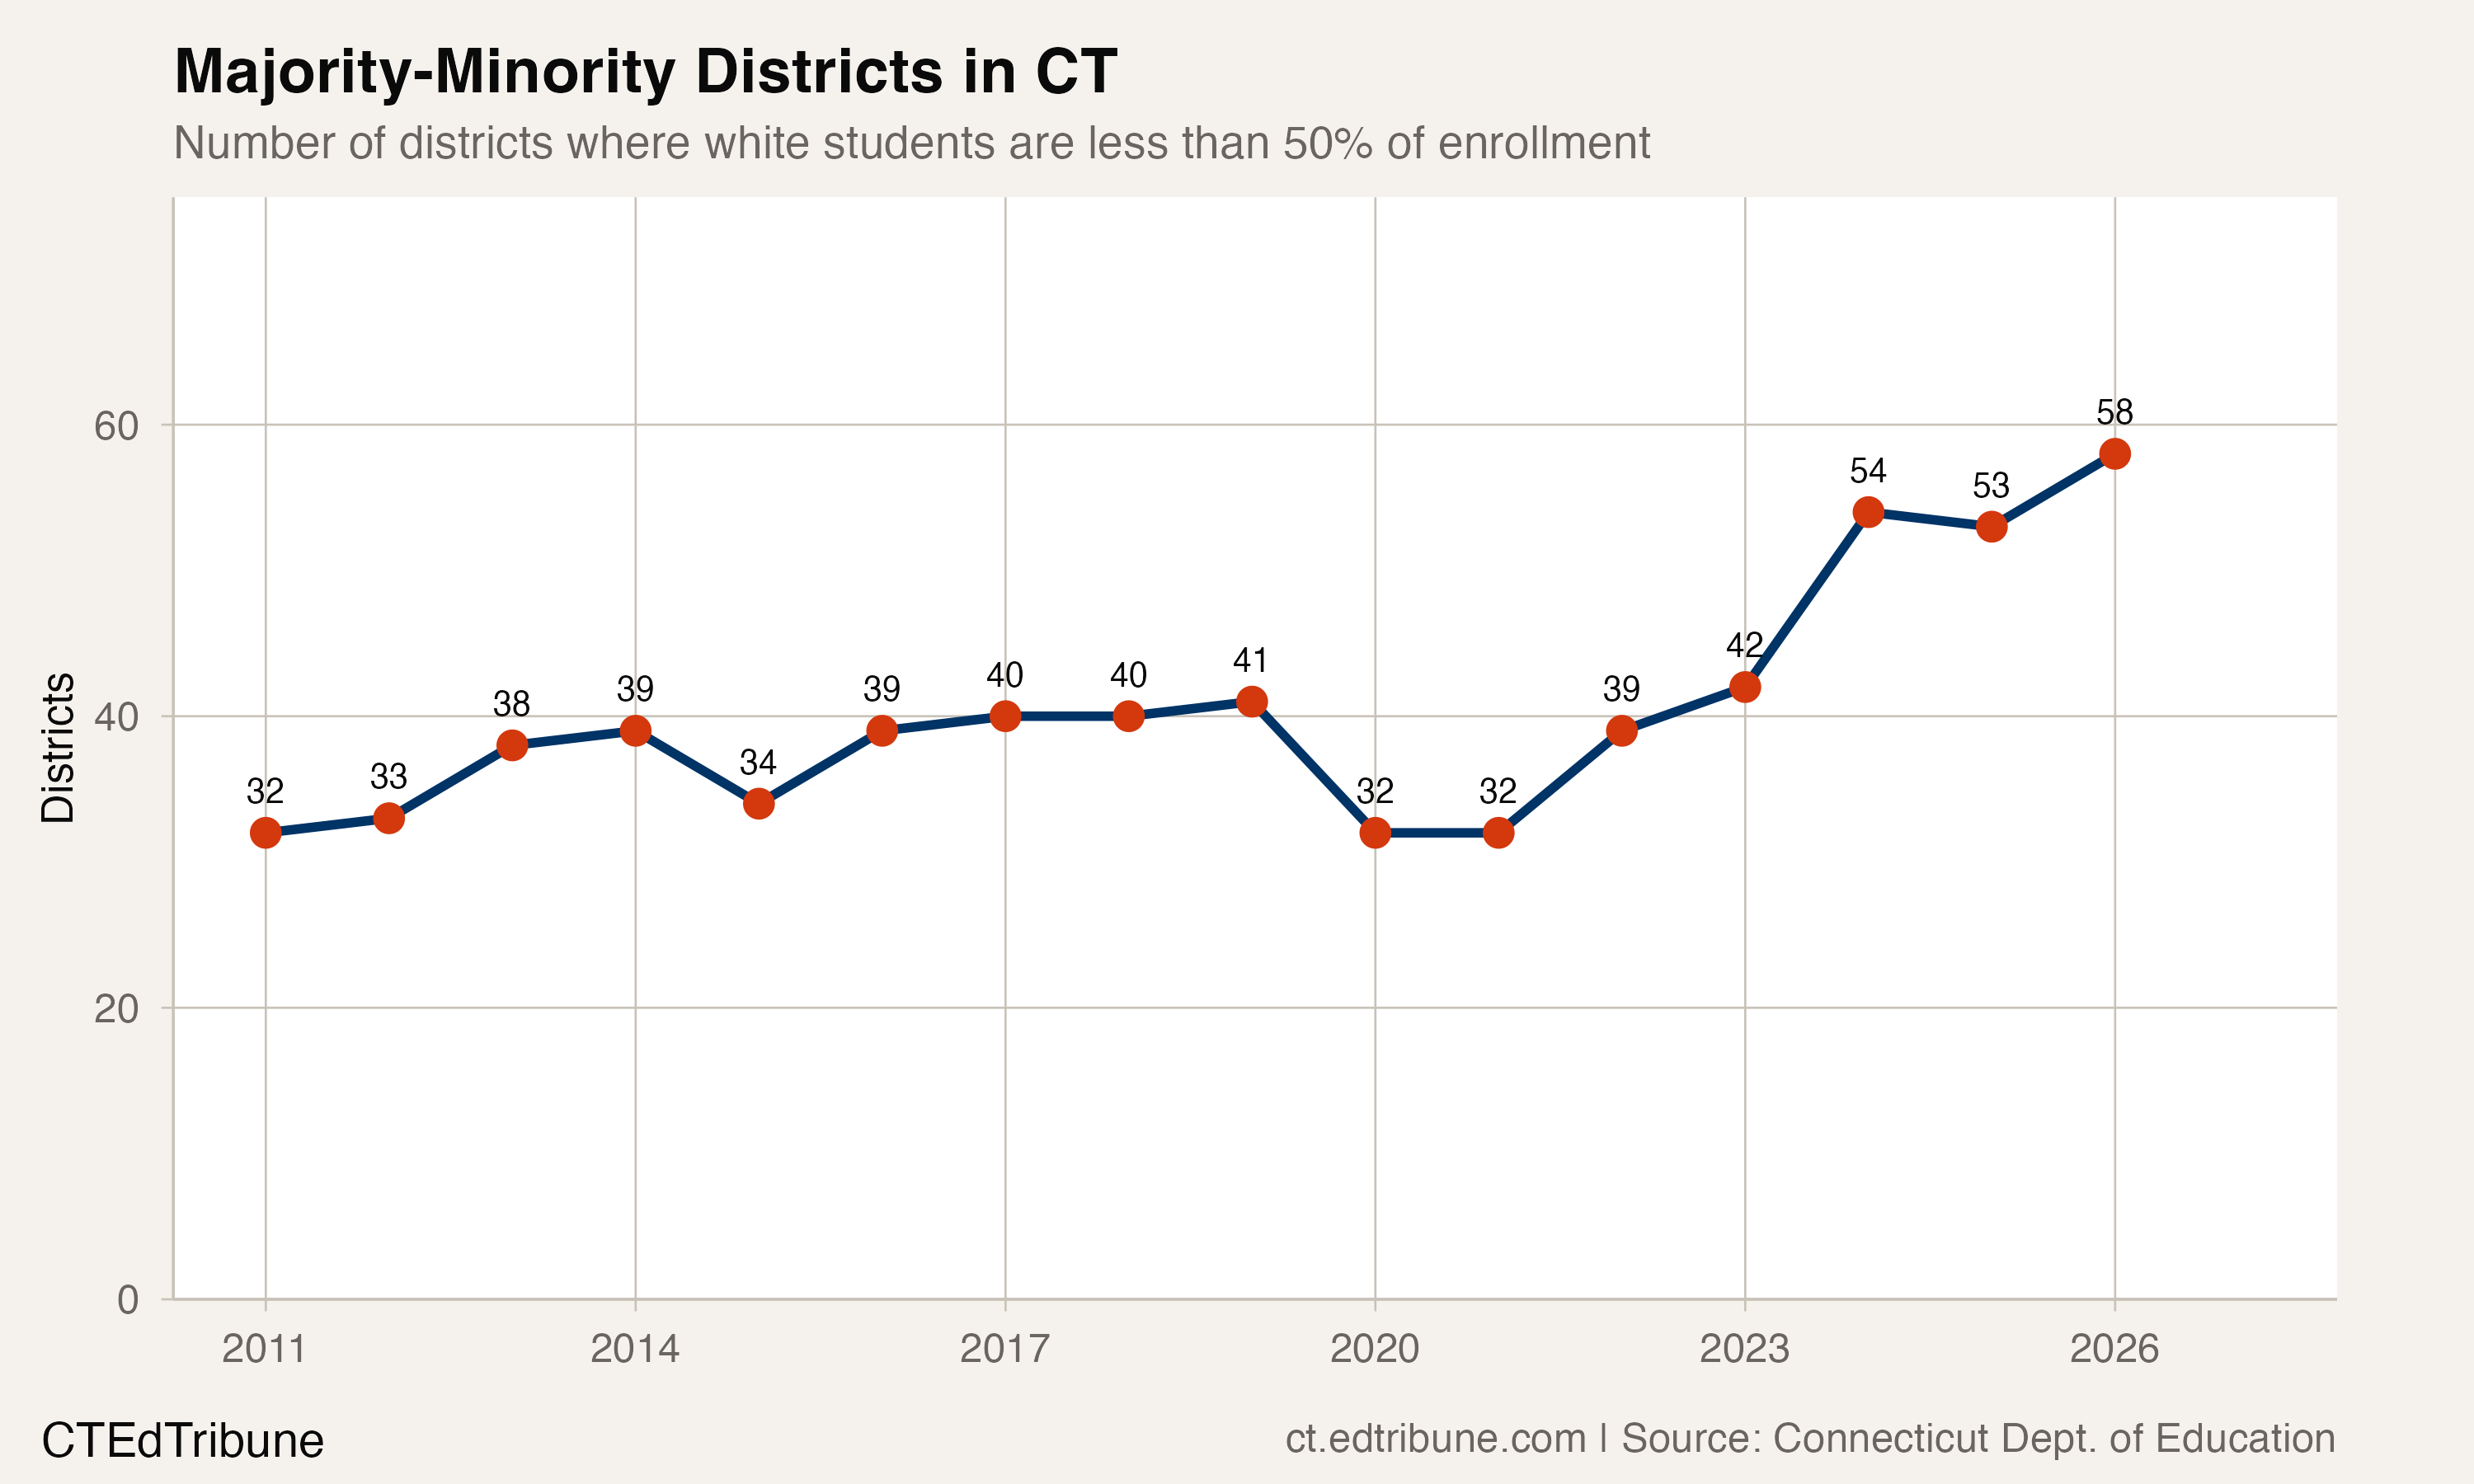
Fifty-eight of Connecticut's 193 districts are now majority-minority, meaning white students make up less than half of enrollment. That is 30.1% of all districts, nearly double the 17.2% in 2011. The shift has moved beyond the cities that anchored it for decades. It has reached Bristol↗ET, a factory town of 60,000 in Hartford County. It has reached East Haven↗ET, a shoreline suburb next to New Haven. It has reached South Windsor↗ET, an affluent Hartford suburb with a median household income above $140,000.
Where the line moved
Connecticut's majority-minority districts used to be a short list of cities: Hartford, Bridgeport, New Haven, Waterbury, New London, Windham. These were places where white share had been below 50% for years, in some cases decades. Hartford was 8.1% white in 2011. Bridgeport was 7.9%. The story was concentrated and familiar.
What changed between 2011 and 2026 is where the next crossings happened. Thirteen traditional public school districts that were majority-white in 2011 are now majority-minority. The crossovers cluster in two geographic rings around the state's urban cores.
The inner ring crossed first and fastest. Derby↗ET, just upriver from Ansonia, went from 56.6% white to 24.0%. Naugatuck↗ET, a Naugatuck Valley town of about 32,000, dropped from 66.7% to 37.0%. Torrington↗ET, the largest town in Litchfield County, fell from 72.3% to 42.7%. In every case, Hispanic enrollment growth was the primary driver: Torrington's Hispanic share rose from 17.2% to 43.8%, East Haven's from 16.8% to 44.1%, Naugatuck's from 18.1% to 42.4%.
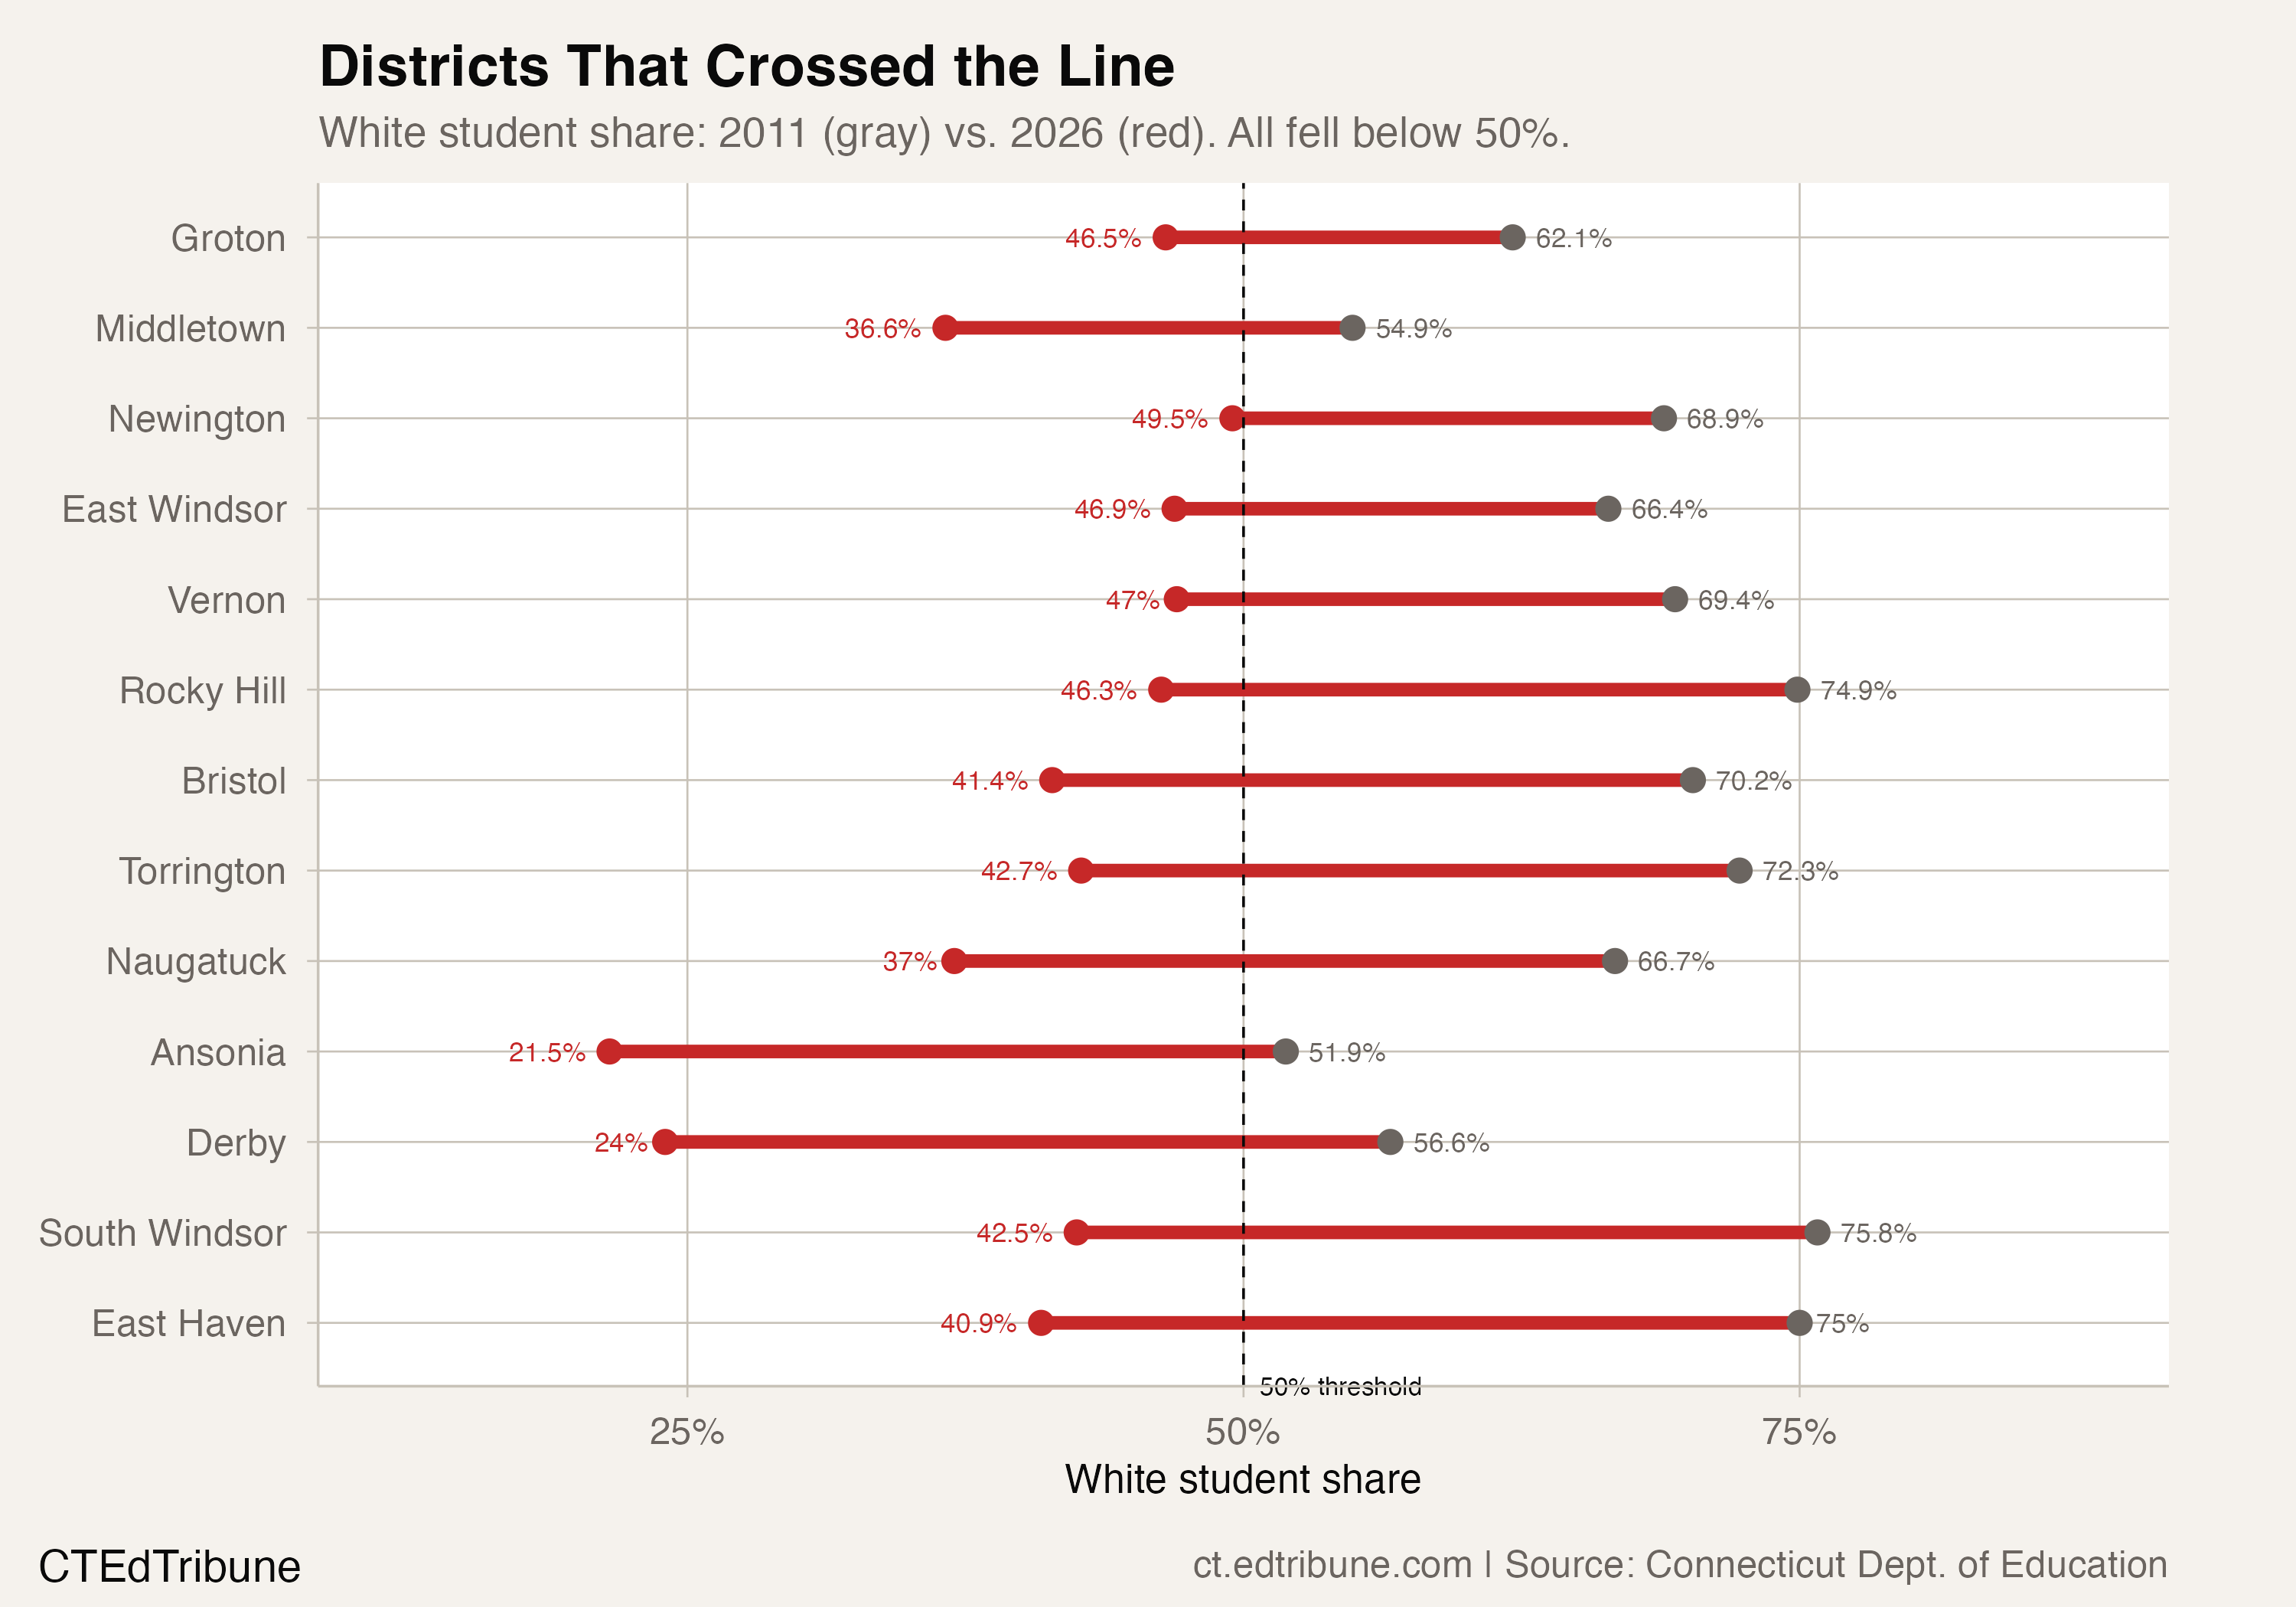
The outer ring tells a different story. South Windsor went from 75.8% white to 42.5%, but the shift was not Hispanic-driven. Asian students grew from 9.5% of enrollment to 35.6%, making South Windsor's crossover unique among the 13. Rocky Hill↗ET, another Hartford suburb, followed a similar pattern: Asian share nearly tripled from 13.5% to 31.0%. In these districts, highly educated families drawn to strong suburban school systems reshaped the enrollment profile from within.

The acceleration after 2022
The trend was gradual for most of the decade. From 2011 to 2019, the number of majority-minority districts grew from 32 to 41, about one new crossover per year. Then something shifted.
Six districts crossed the threshold in 2022 alone: Bristol, East Windsor, Groton, South Windsor, Torrington, and Norwich Free Academy. By 2024, the count had jumped to 54. (The apparent dip to 32 in 2020-2021 reflects a data reporting gap: 18 entities, mostly charter schools and regional service centers, temporarily dropped from the enrollment files during the pandemic. Most were already majority-minority. The underlying trend in traditional districts was continuous.)
Part of this acceleration reflects broader demographic math. Statewide, white students fell below 50% for the first time in 2021, hitting 49.9%. By 2026, they are 44.7% of enrollment. As the statewide share drops, more individual districts approach and cross the threshold, and the crossings compound. A district at 55% white in 2019 that lost two percentage points per year would cross at 51% by 2021 and sit at 43% by 2025.
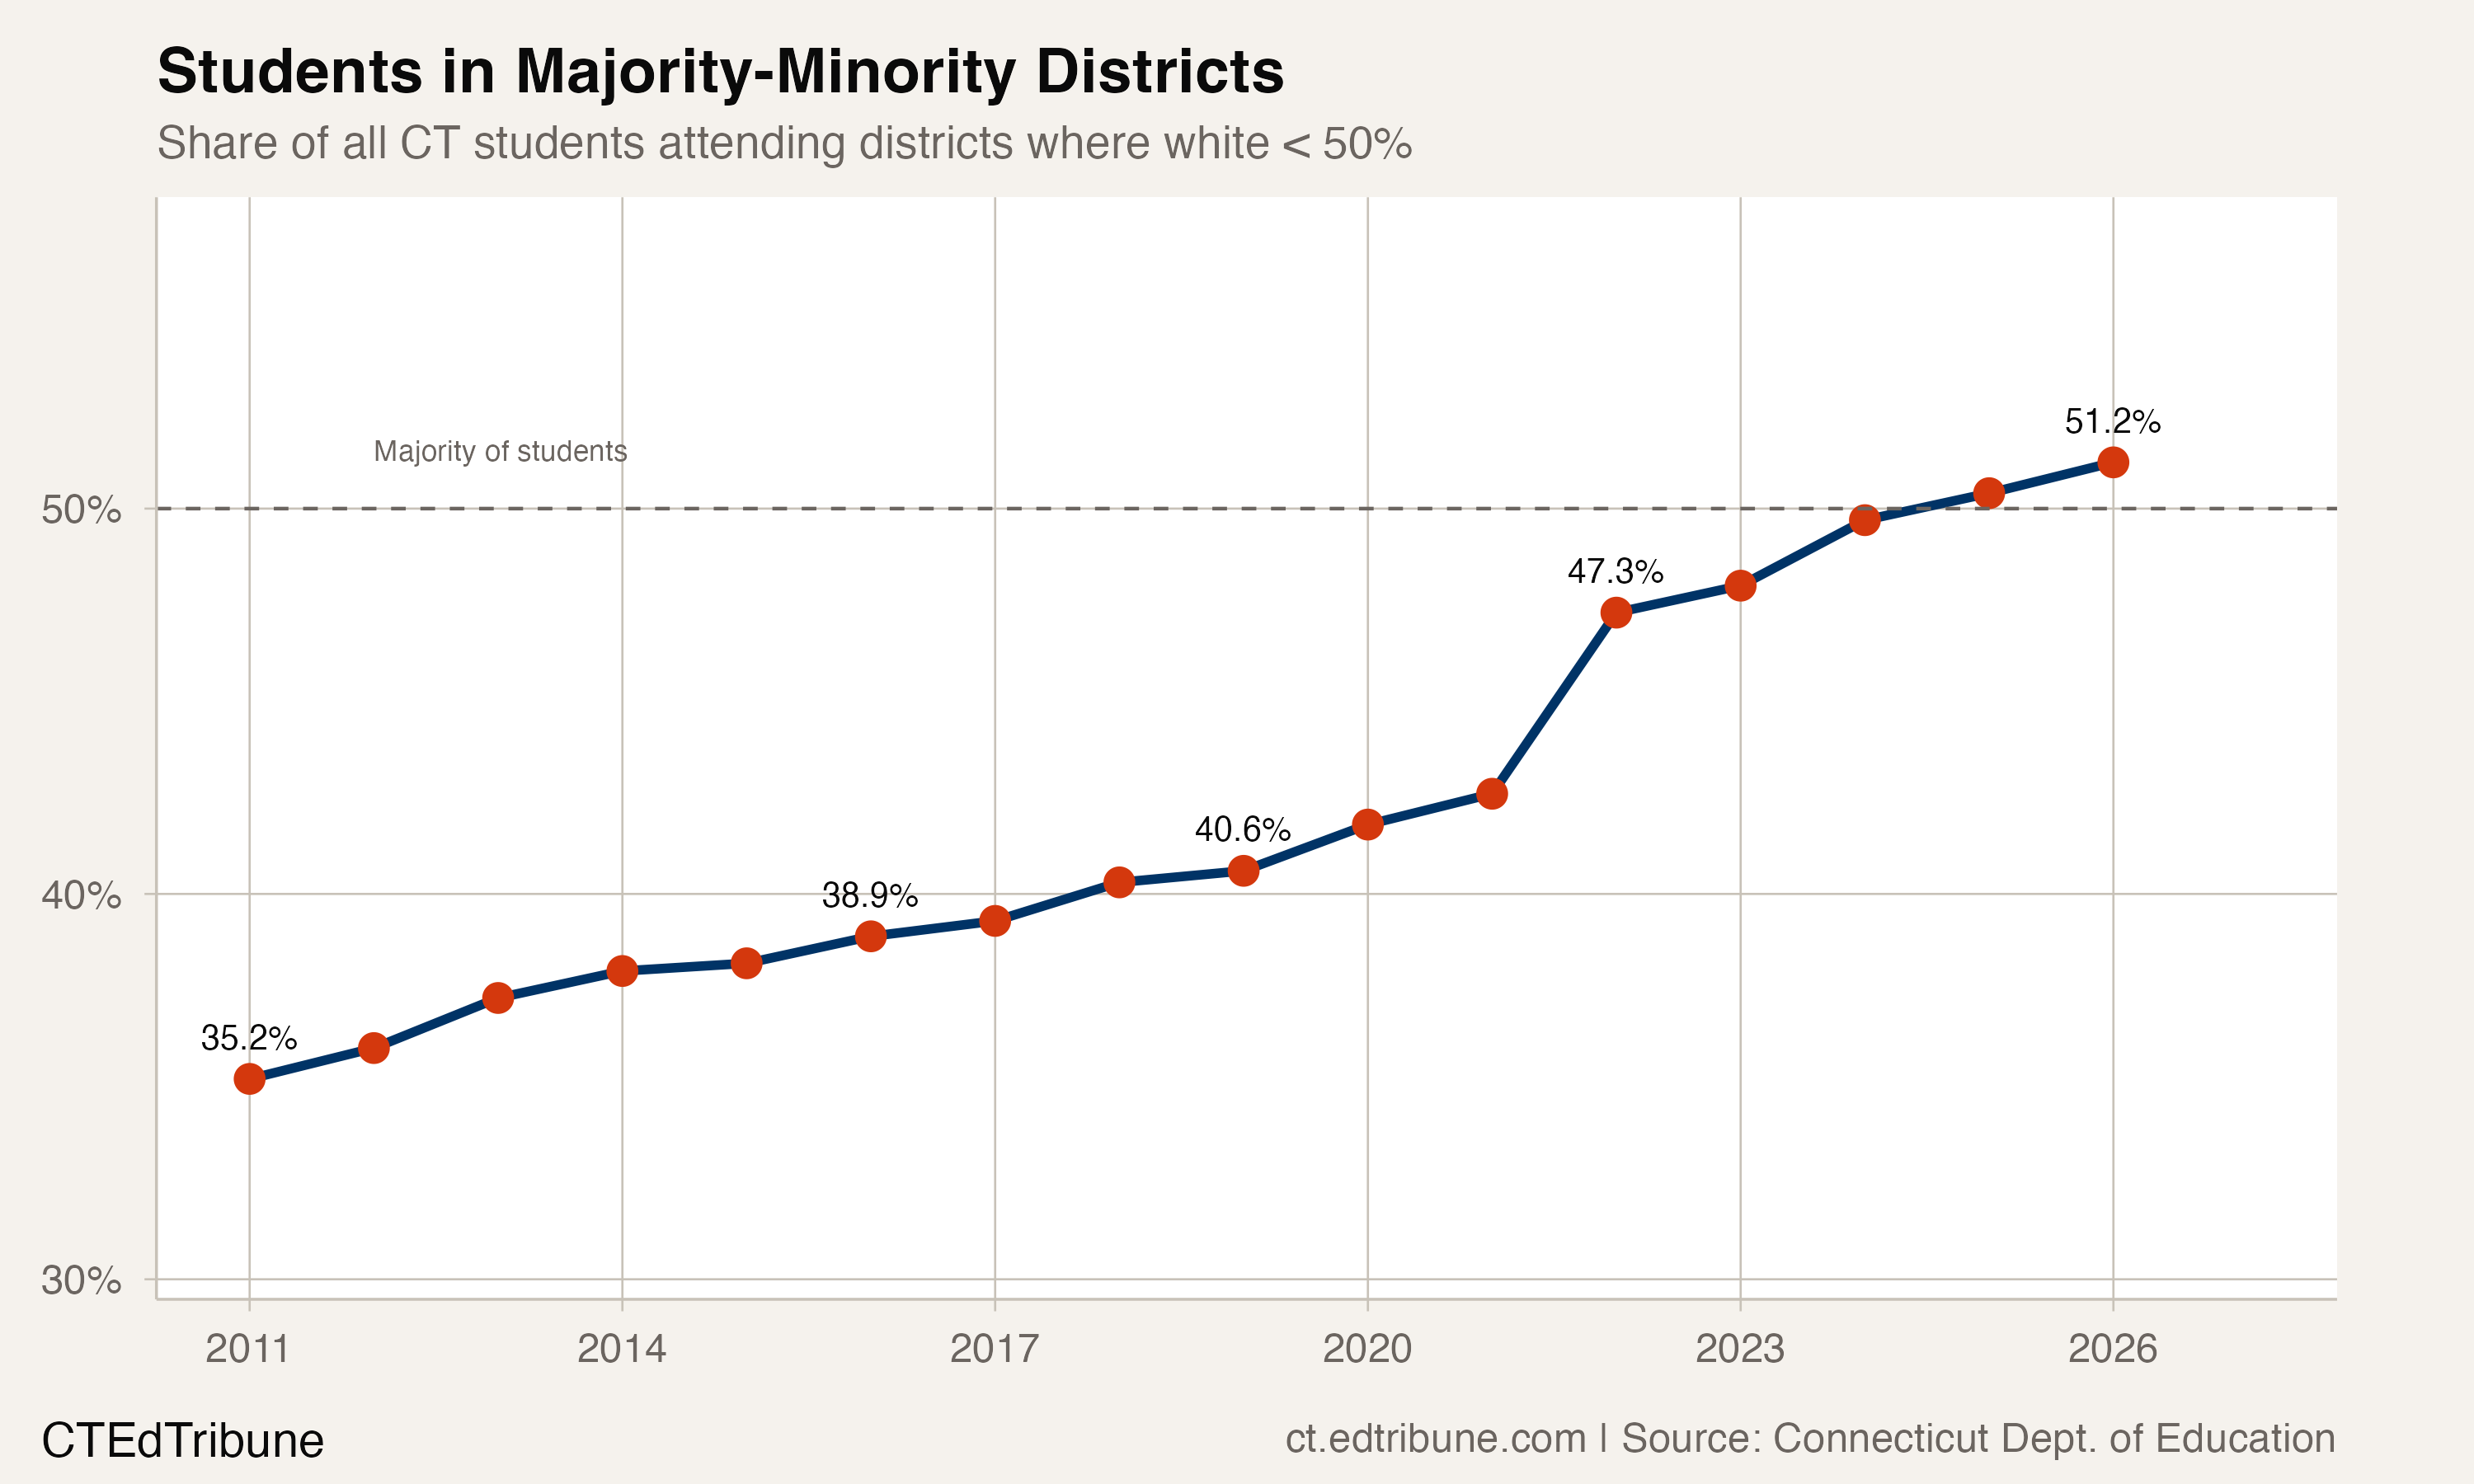
The practical consequence: a majority of Connecticut's students, 51.2%, now attend majority-minority districts. In 2011, that figure was 35.2%. The shift is not just about where the line is drawn on a map. It is about how many students live on each side of it.
Two forces, one destination
The crossover districts split into two distinct demographic pathways, and the distinction matters for the communities involved.
In the Naugatuck Valley and shoreline suburbs, Hispanic families have moved outward from New Haven, Waterbury, and Hartford into adjacent towns. East Haven, which shares a border with New Haven, saw Hispanic enrollment rise by 27.3 percentage points. Bristol, the largest of the crossover districts with 7,597 students, saw Hispanic share climb from 18.0% to 40.3%. These are working-class and middle-class communities where housing costs are lower than in the wealthier Fairfield County suburbs further south.
Connecticut's Latino population has grown by about 80,000 residents between 2018 and 2023, roughly a 14% increase. That growth has spread well beyond Hartford, New Haven, and Bridgeport into suburban and small-city communities across the state. The suburban expansion of Latino families is reshaping the enrollment maps of districts that had been demographically stable for decades.
In the Hartford suburbs, a different force is at work. South Windsor and Rocky Hill are affluent communities where the demographic shift is driven primarily by Asian families, many of them professionals drawn to strong school systems and proximity to Hartford's insurance and technology employers. South Windsor's Asian student share nearly quadrupled from 9.5% to 35.6%, while Hispanic enrollment grew more modestly from 6.8% to 11.2%. The town's median household income exceeds $144,000.
These two pathways produce the same statistical outcome, a majority-minority district, but represent fundamentally different community dynamics.
The next wave at the gates
Eleven more traditional districts sit between 50% and 60% white in 2026. Farmington↗ET, at 51.1% white, is the closest to crossing. Like South Windsor, its shift is Asian-driven: Asian students grew from 12.6% to 24.9% of enrollment. West Hartford↗ET, the state's ninth-largest district with 9,069 students, sits at 53.5% white, down from 62.3% in 2011.
Further out, Shelton (55.2% white, down from 82.3%), Trumbull (56.9%, down from 82.4%), and Greenwich (58.9%, down from 70.5%) have each shed more than 10 percentage points of white share since 2011. Whether the pace continues is uncertain, but the direction has been consistent. These are some of Connecticut's wealthiest communities.

What segregation looks like now
Connecticut is divided into 169 towns largely separated by race and wealth, a legacy of exclusionary zoning, restrictive covenants, and autonomous municipalities with independent school systems. The 1996 Sheff v. O'Neill ruling found that Hartford's racial isolation violated the state constitution, producing a magnet school and Open Choice program that now serves over 56% of Hartford students.
But the demographic data reveals a paradox. Connecticut's school segregation may be eroding not through court orders or magnet programs, but through residential migration that is slowly diversifying the suburbs. The share of districts that are majority-minority has nearly doubled. The share of students in those districts has crossed 50%. The demographic composition of towns like East Haven and Naugatuck in 2026 would have been unrecognizable to residents in 2011.
"This achievement represents more than a number. It reflects the state's deep commitment to expanding meaningful educational choices for students and families." — Education Commissioner Charlene M. Russell-Tucker, on the Sheff settlement milestone, Hartford Courant, December 2025
Yet the structural segregation persists in a different form. More than half of Connecticut's Black, Indigenous, and Latino students still attend districts where over 75% of students are students of color. Hartford is 5.6% white. Bridgeport is 7.2%. The wave has reached the suburbs, but it has not reached the wealthiest ones: Darien, Weston, and New Canaan remain above 75% white. The geographic spread of majority-minority districts is real, but so is the concentration of students of color in a handful of urban systems.
Farmington at the line
At 51.1% white, Farmington is a single school year from crossing the threshold. Its neighbor West Hartford is three points behind. If both cross, two of the Hartford region's most sought-after school districts will join a list that until recently consisted of cities, factory towns, and working-class suburbs.
A district at 49% white and a district at 51% white serve similar student populations. The 50% line is a statistical marker, not a cliff. But in a state whose school system was built on the premise that suburbs and cities are separate worlds, every crossing chips away at that premise a little more.
Connecticut's 169 towns drew those lines. The families moving through them are redrawing the map.
Detailed code that reproduces the analysis and figures in this article is available exclusively to EdTribune subscribers.
Discussion
Sign in to join the discussion.
Loading comments...