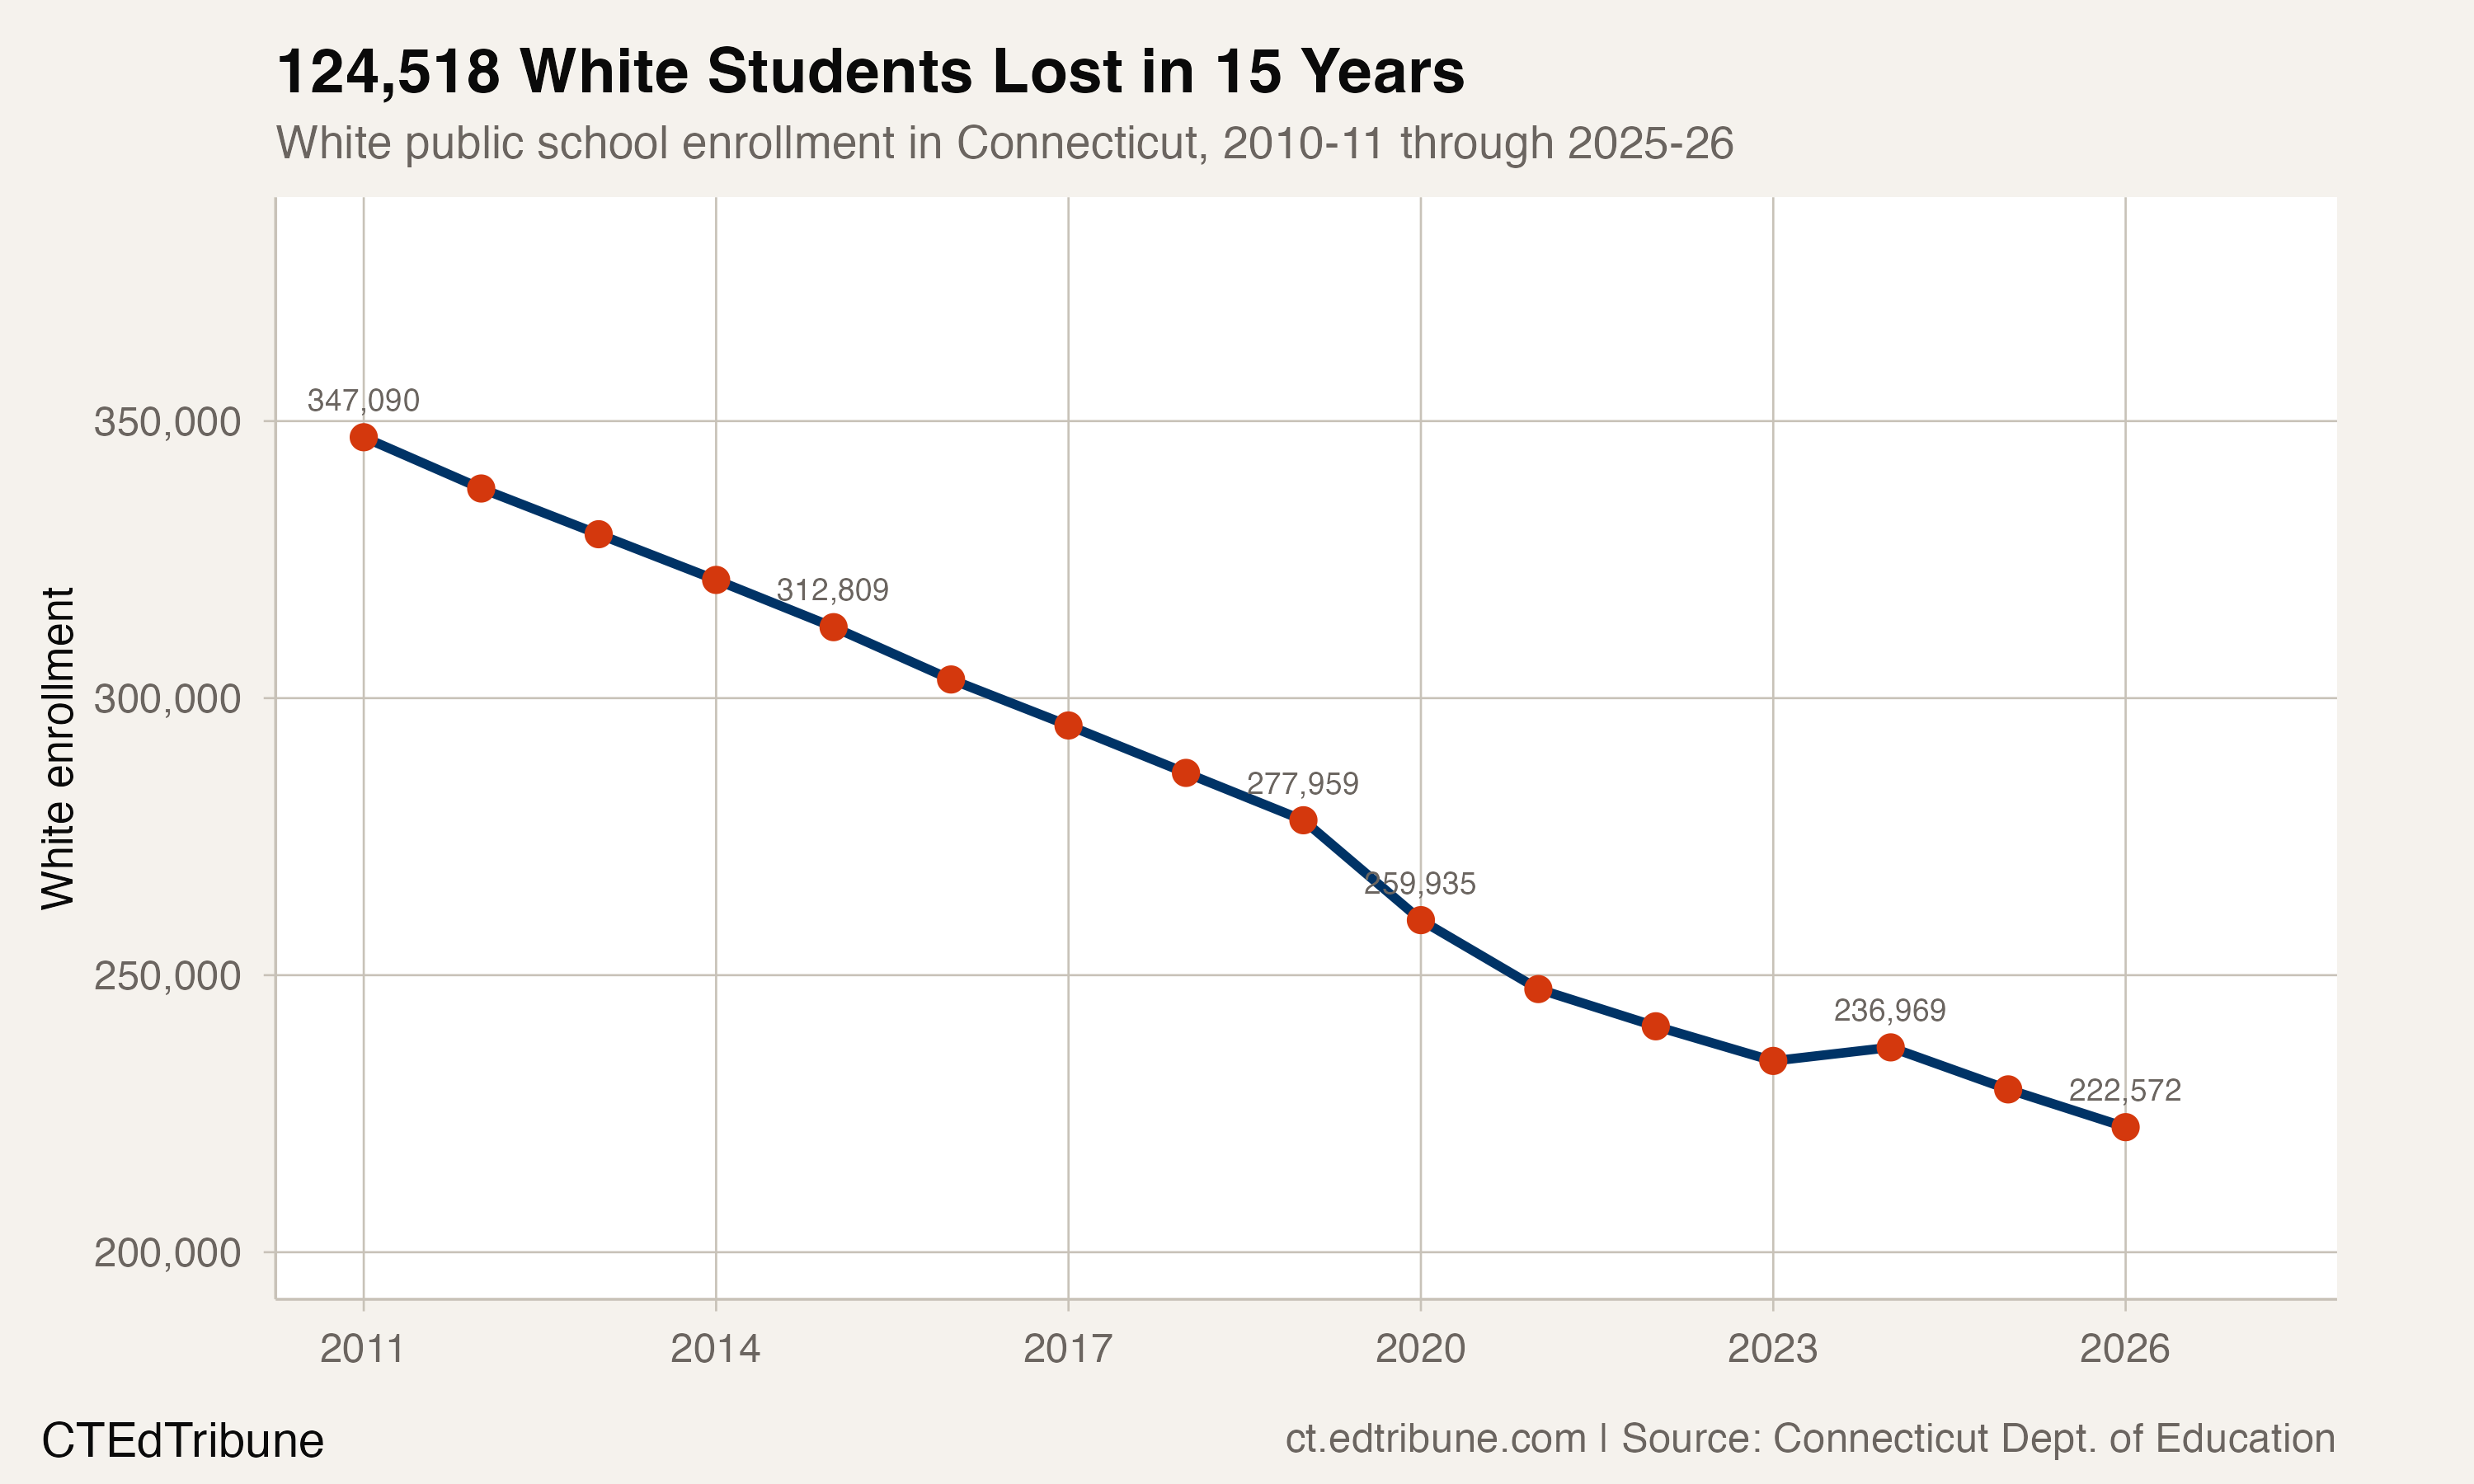
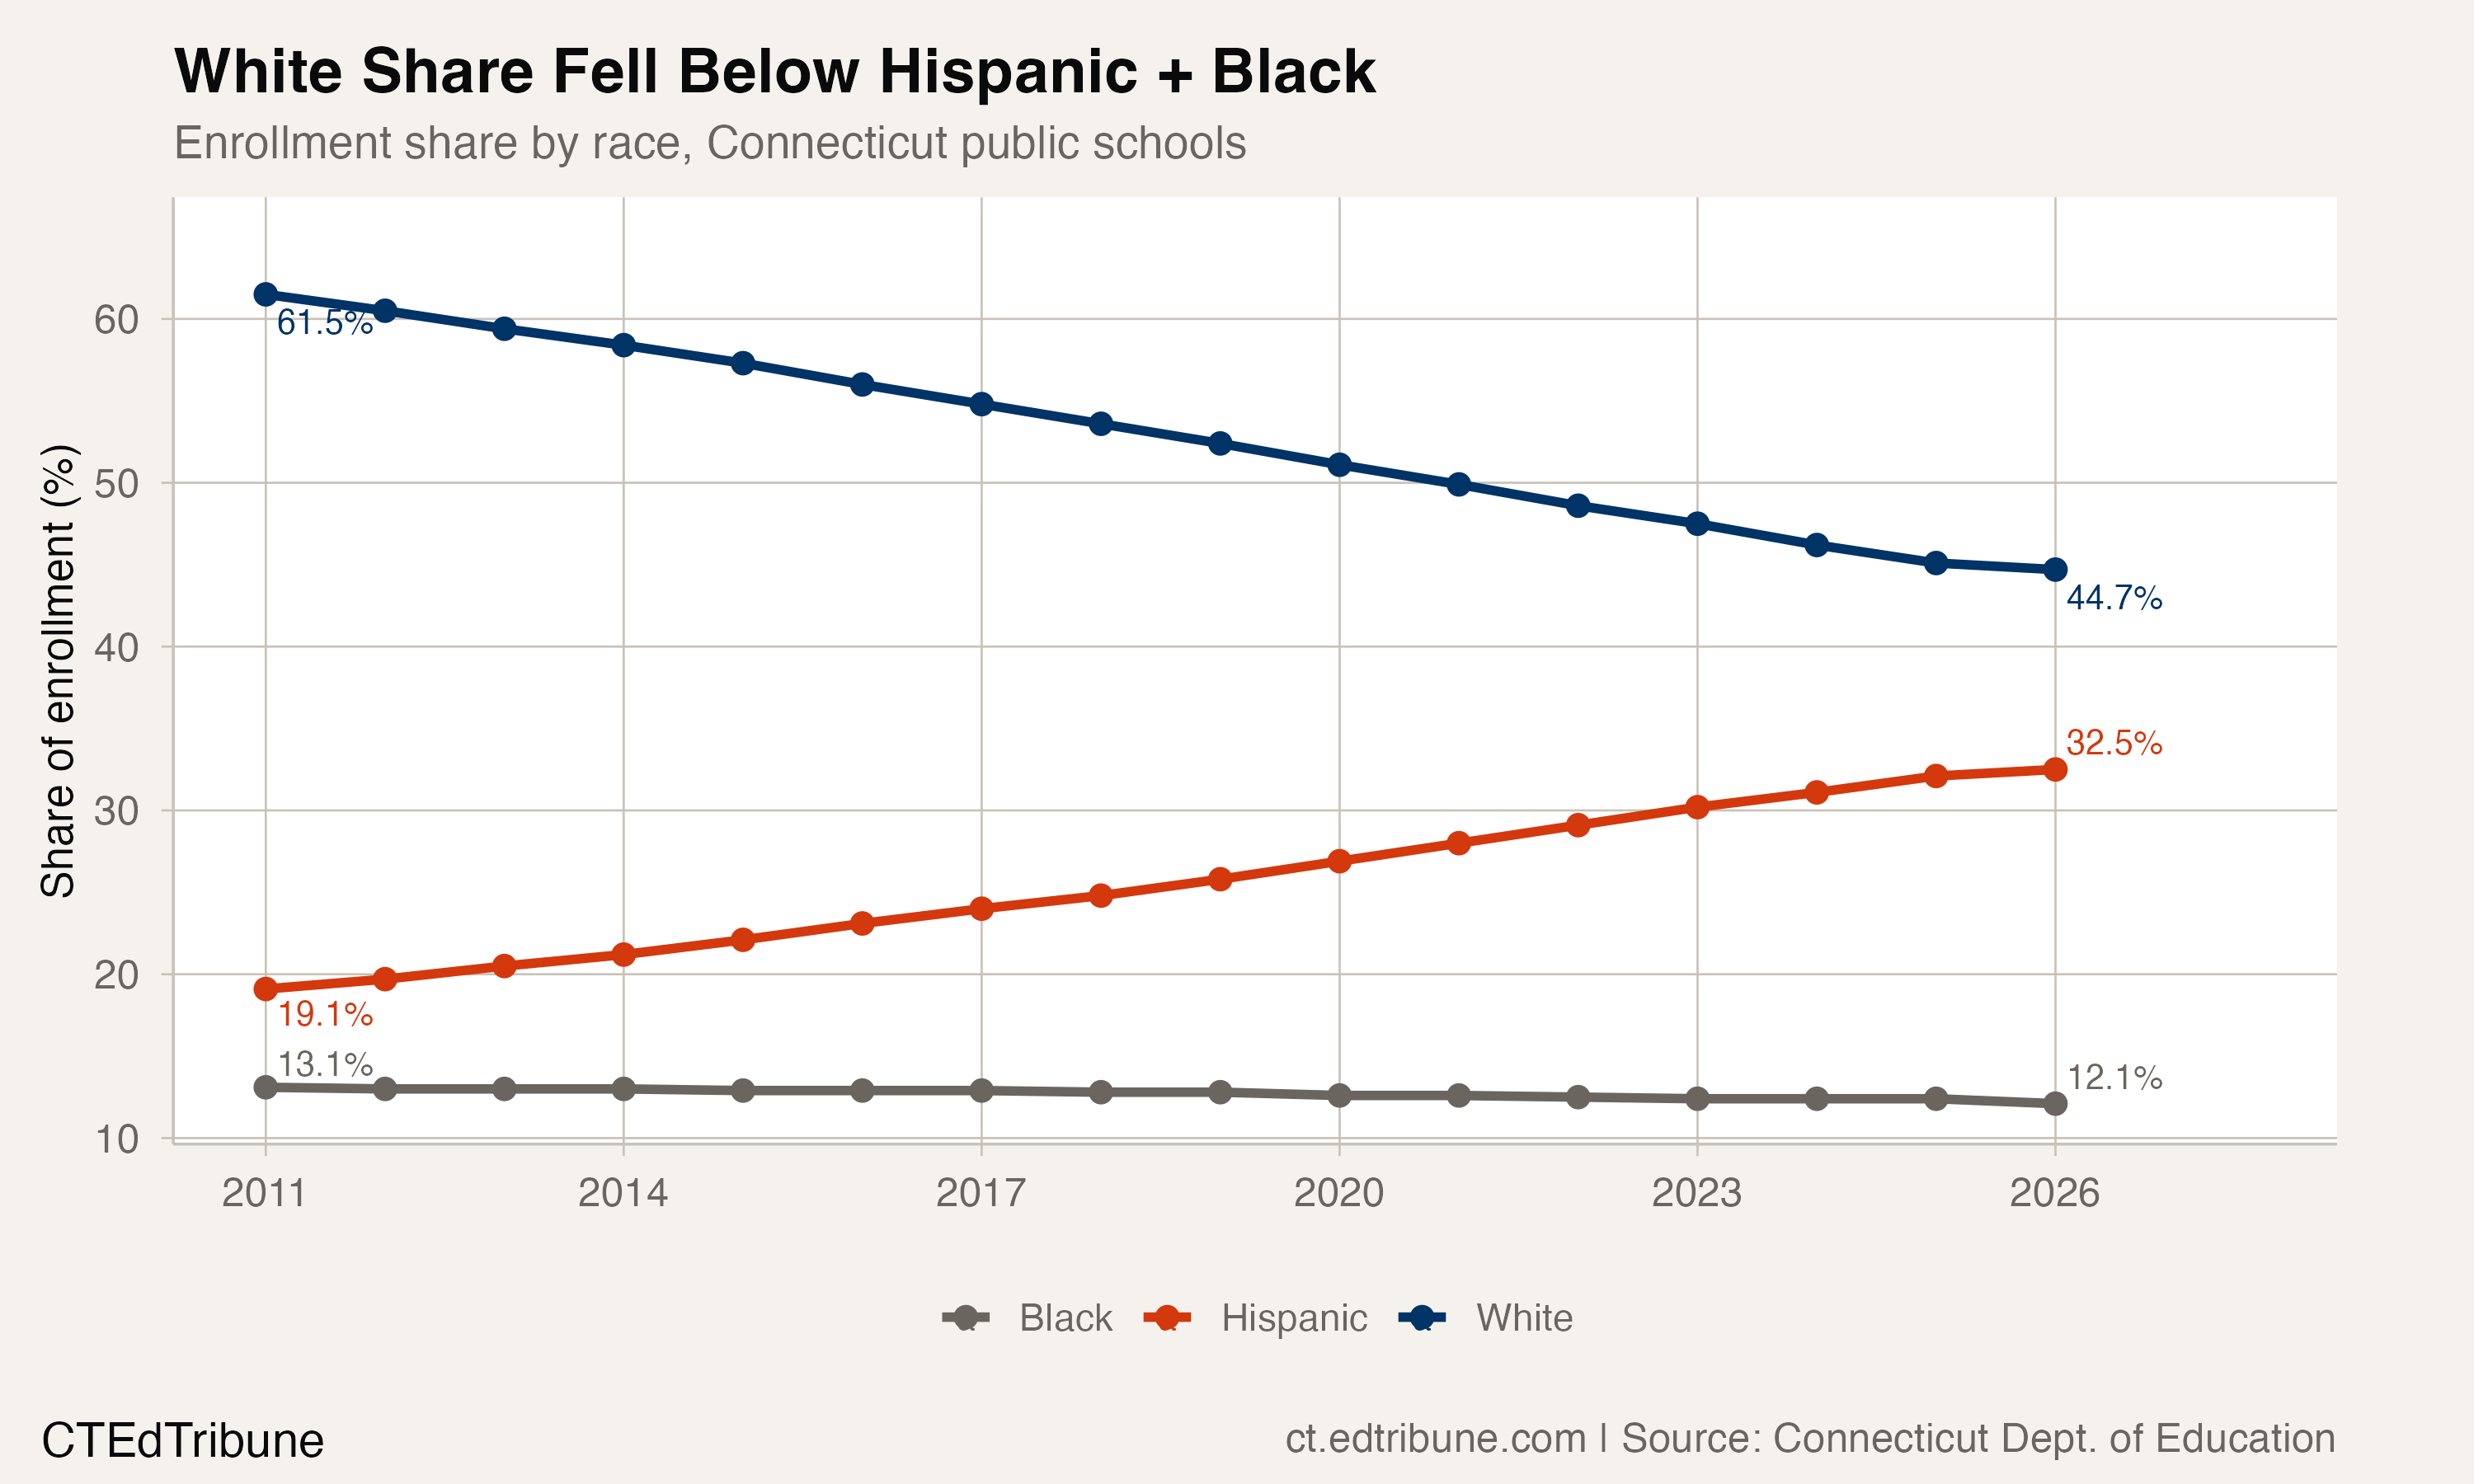
In 2010-11, three out of five students in Connecticut public schools were white. Fifteen years later, white students are a minority. The state lost 124,518 white students over that span, a 35.9% decline, while total enrollment fell just 11.8%. White enrollment dropped in 14 of 15 years, with only a single-year interruption in 2023-24. No other racial group in Connecticut has experienced a contraction of this speed or scale.
The statewide number, though, obscures the more revealing story: what happened inside the suburbs. Districts that were 75% or 80% white at the start of the decade are now below 50%. The transformation did not require a single family to move. It happened through the slow accumulation of differential birth rates, immigration patterns, and generational turnover in communities that still look, from the outside, like the Connecticut of 20 years ago.
The arithmetic of 8,000 a year
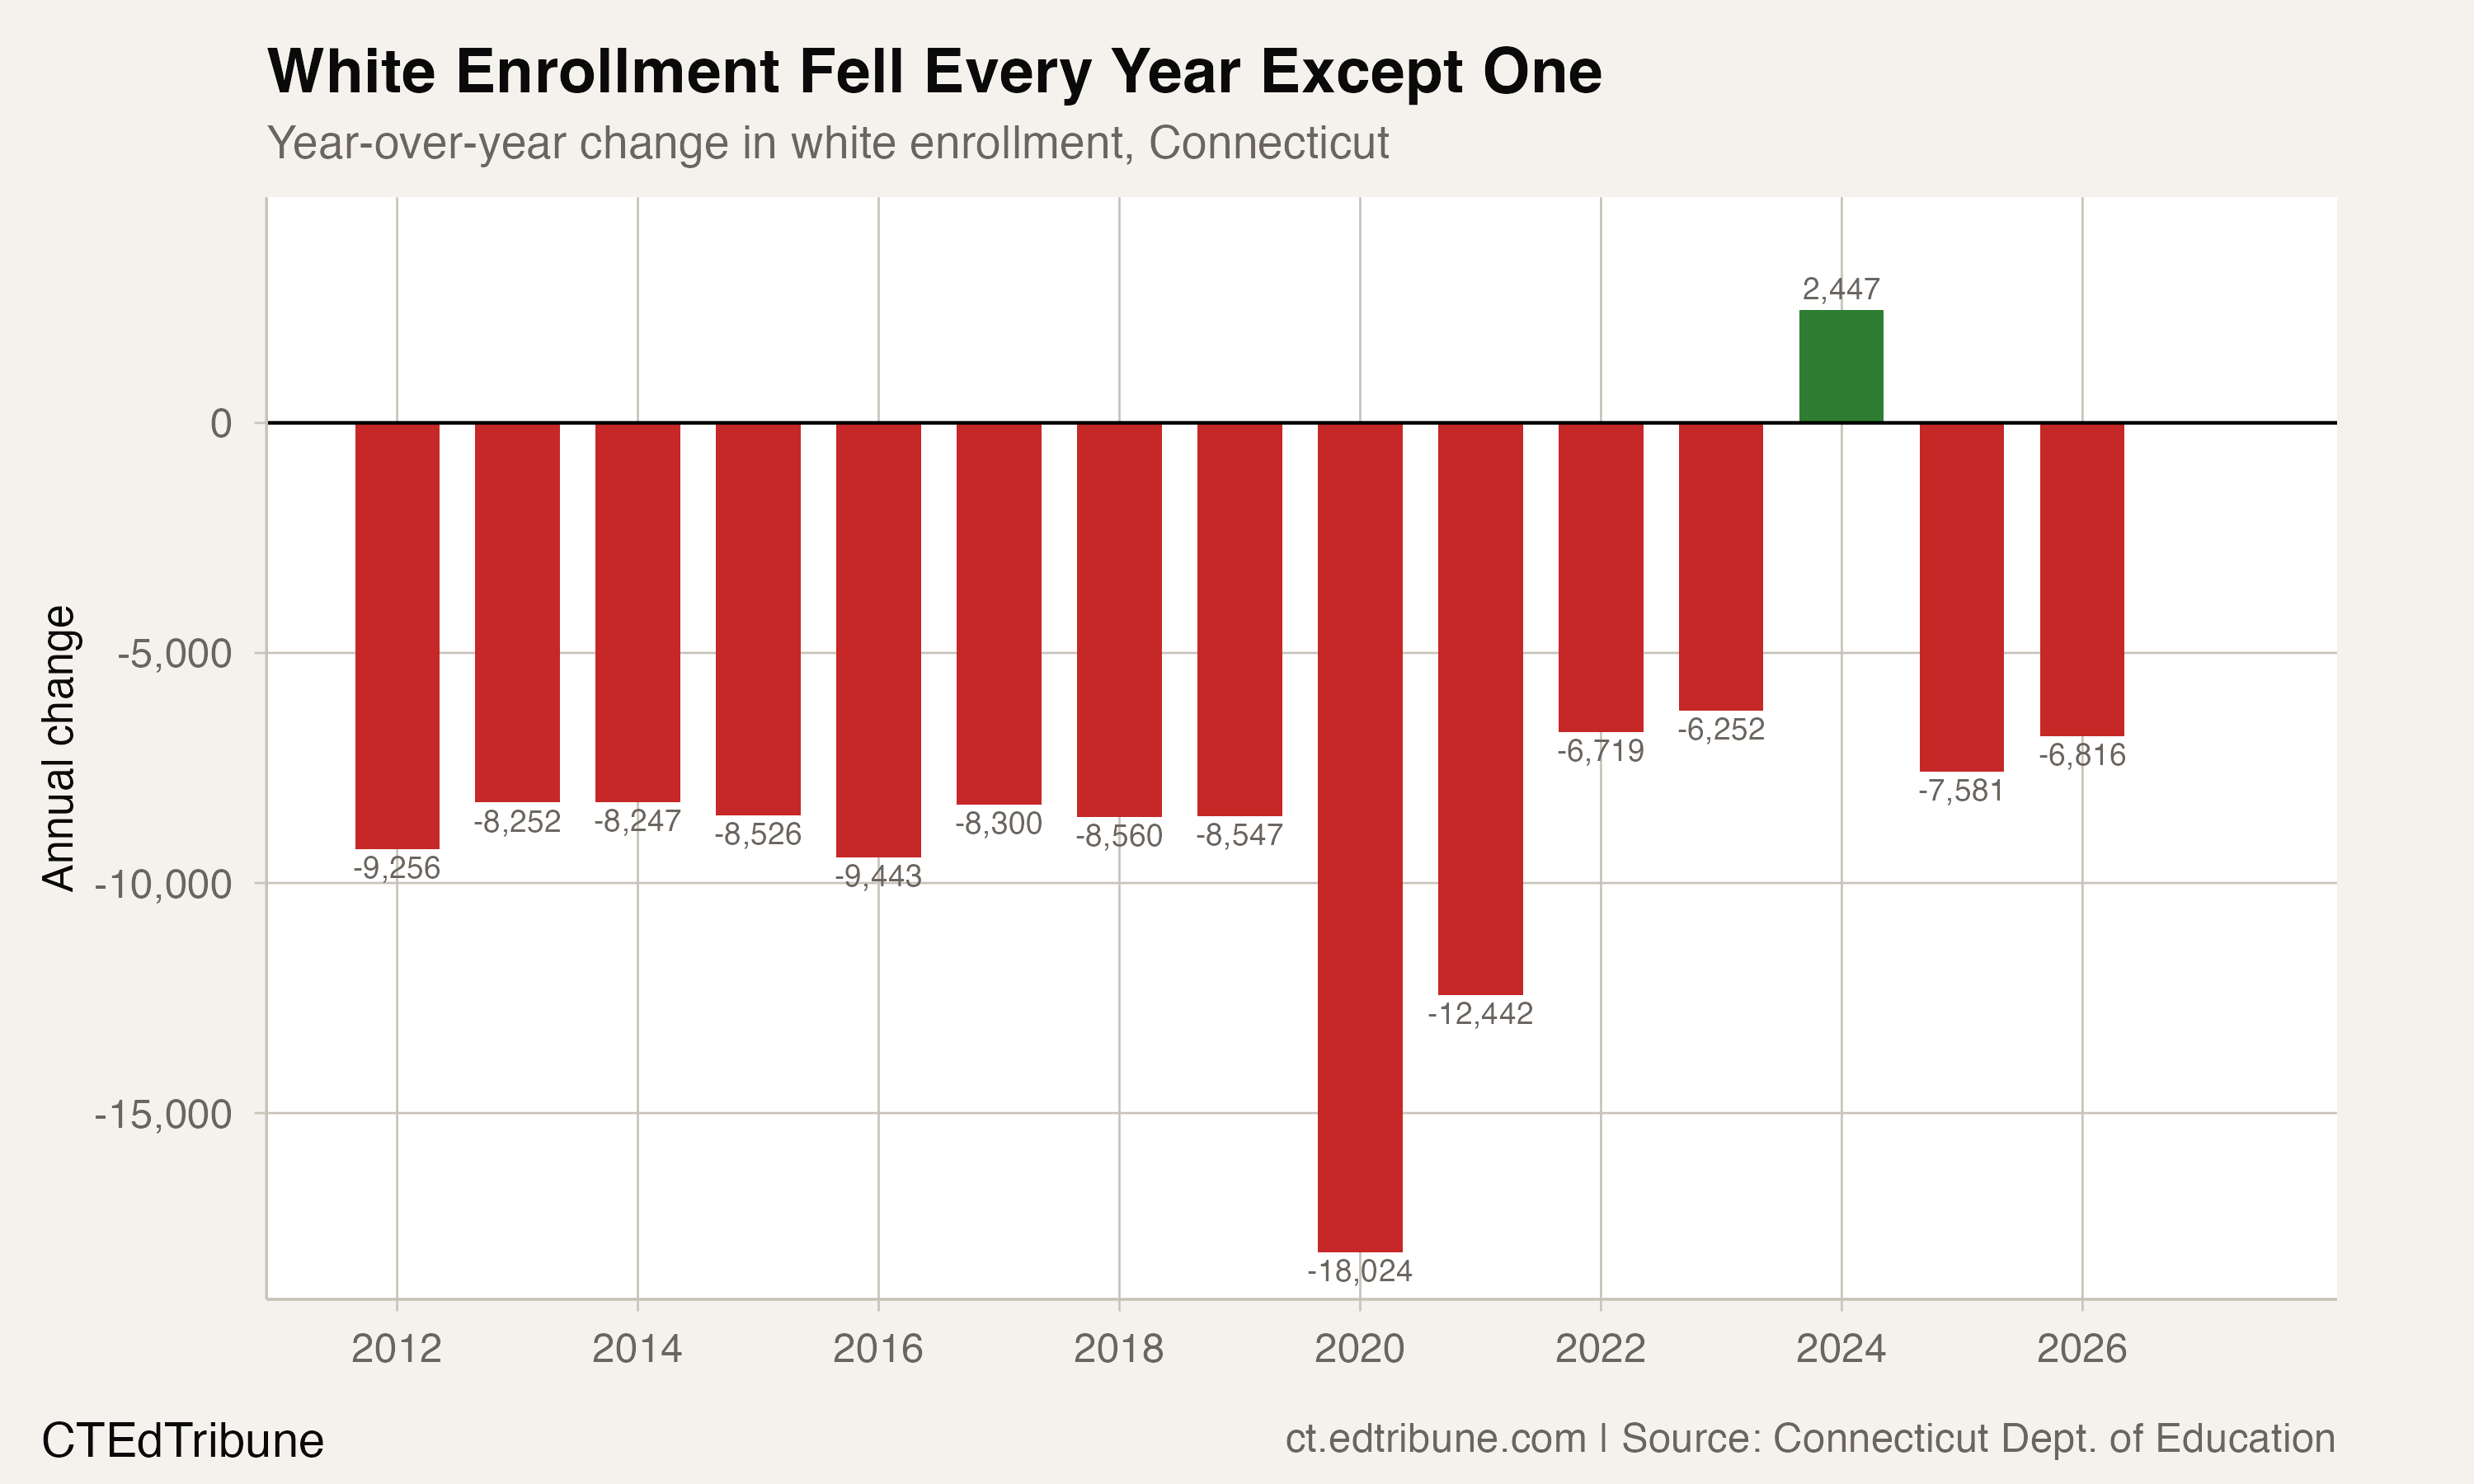
Before the pandemic, Connecticut lost white students at a remarkably steady pace: roughly 8,600 per year, every year, from 2012 through 2019. The losses ranged from 8,247 to 9,443, a consistency that points to structural demographics rather than any single policy or event. White enrollment fell from 347,090 in 2010-11 to 277,959 in 2018-19.
COVID accelerated the losses. In 2019-20, white enrollment plunged by 18,024, the single largest one-year drop on record, followed by another 12,442 the next year. The pandemic years erased what would have been roughly four years of normal attrition in two.
Post-pandemic, the annual white losses settled into a slightly lower baseline of about 6,000 to 7,600 per year, with one notable exception: 2023-24 saw a gain of 2,447 white students, the only positive year in the entire 15-year series. That gain coincided with a post-COVID plateau in statewide enrollment, likely reflecting returning students and stabilized counting. By 2024-25, white enrollment resumed its decline, falling 7,581 in a single year.
Two kinds of suburban transformation
The district-level data reveals that white enrollment erosion is not a single phenomenon. It follows at least two distinct pathways, driven by different populations and concentrated in different types of communities.
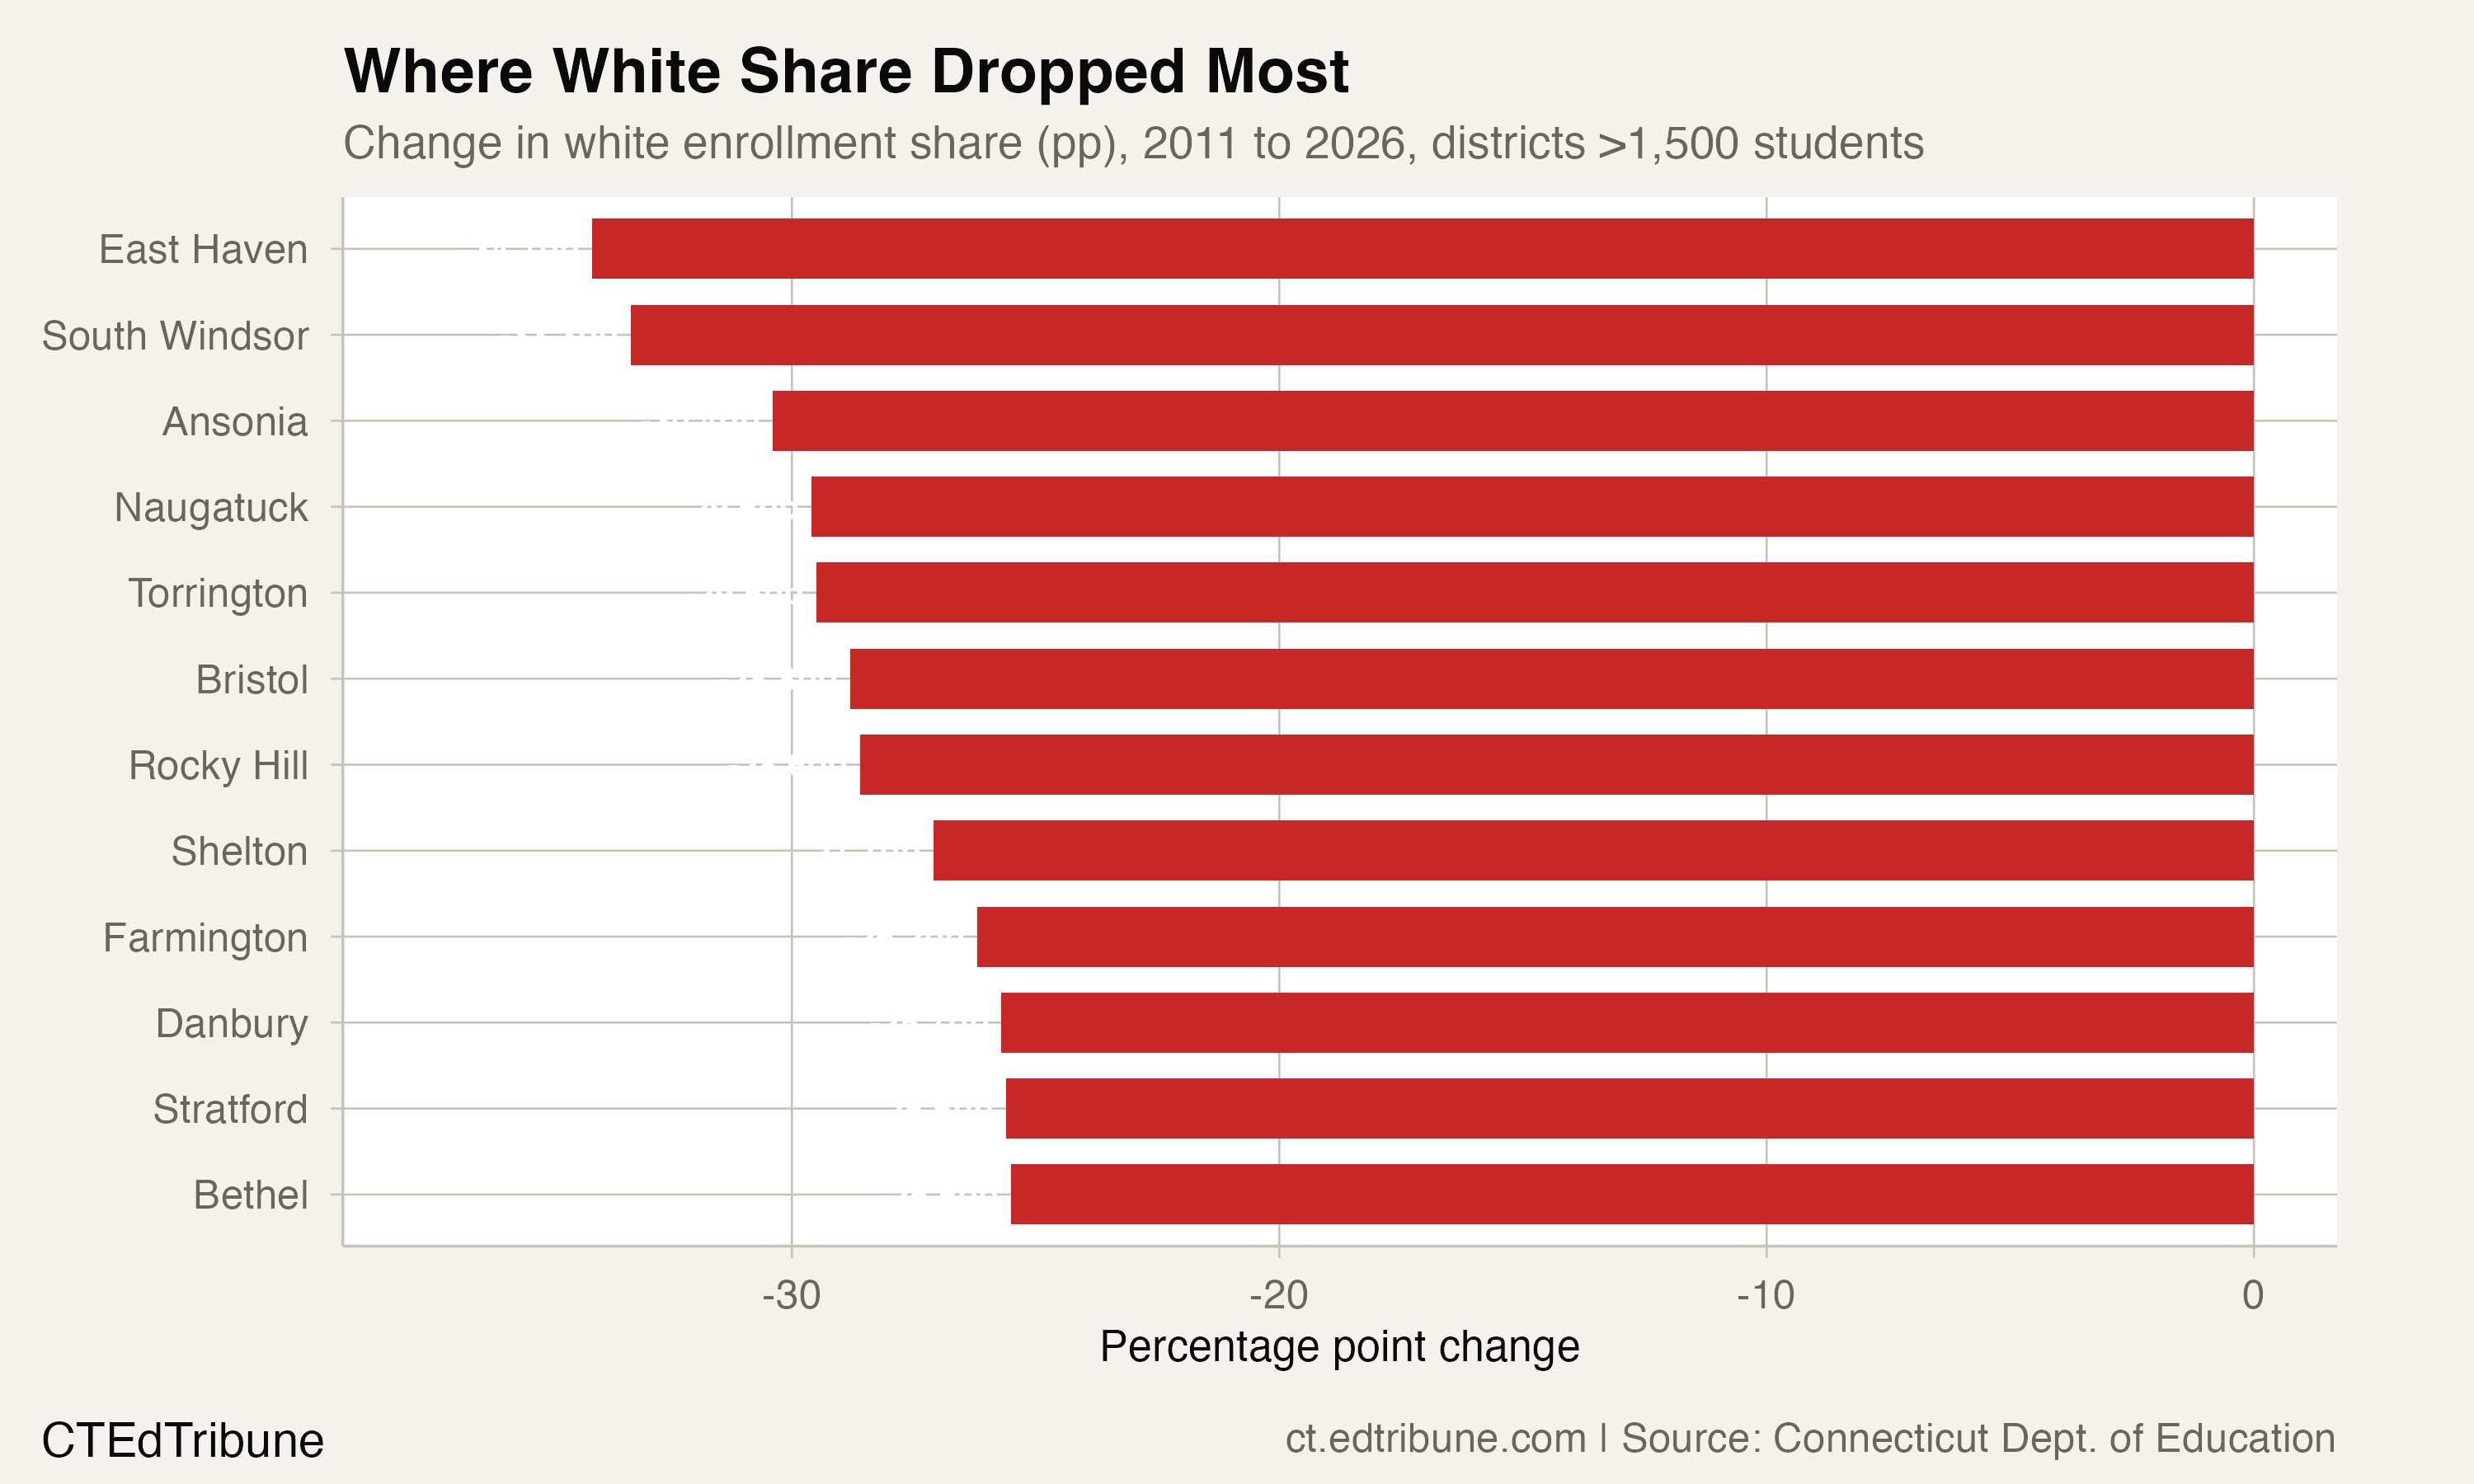
The first pathway is Hispanic-driven. In East Haven↗ET, a working-class suburb on the New Haven shoreline, white share fell from 75.0% to 40.9%, a drop of 34.1 percentage points. Hispanic enrollment filled the gap, rising from 16.8% to 44.1%. Bristol↗ET followed a similar trajectory: 70.2% white in 2011, 41.4% in 2025-26, with Hispanic enrollment climbing from 18.0% to 40.3%. Torrington↗ET, Naugatuck↗ET, and Ansonia↗ET all show the same pattern. These are mill towns and inner-ring suburbs where housing costs are lower, and where Latino families have been steadily relocating from Hartford, New Haven, and Bridgeport in search of cheaper housing and different school environments.
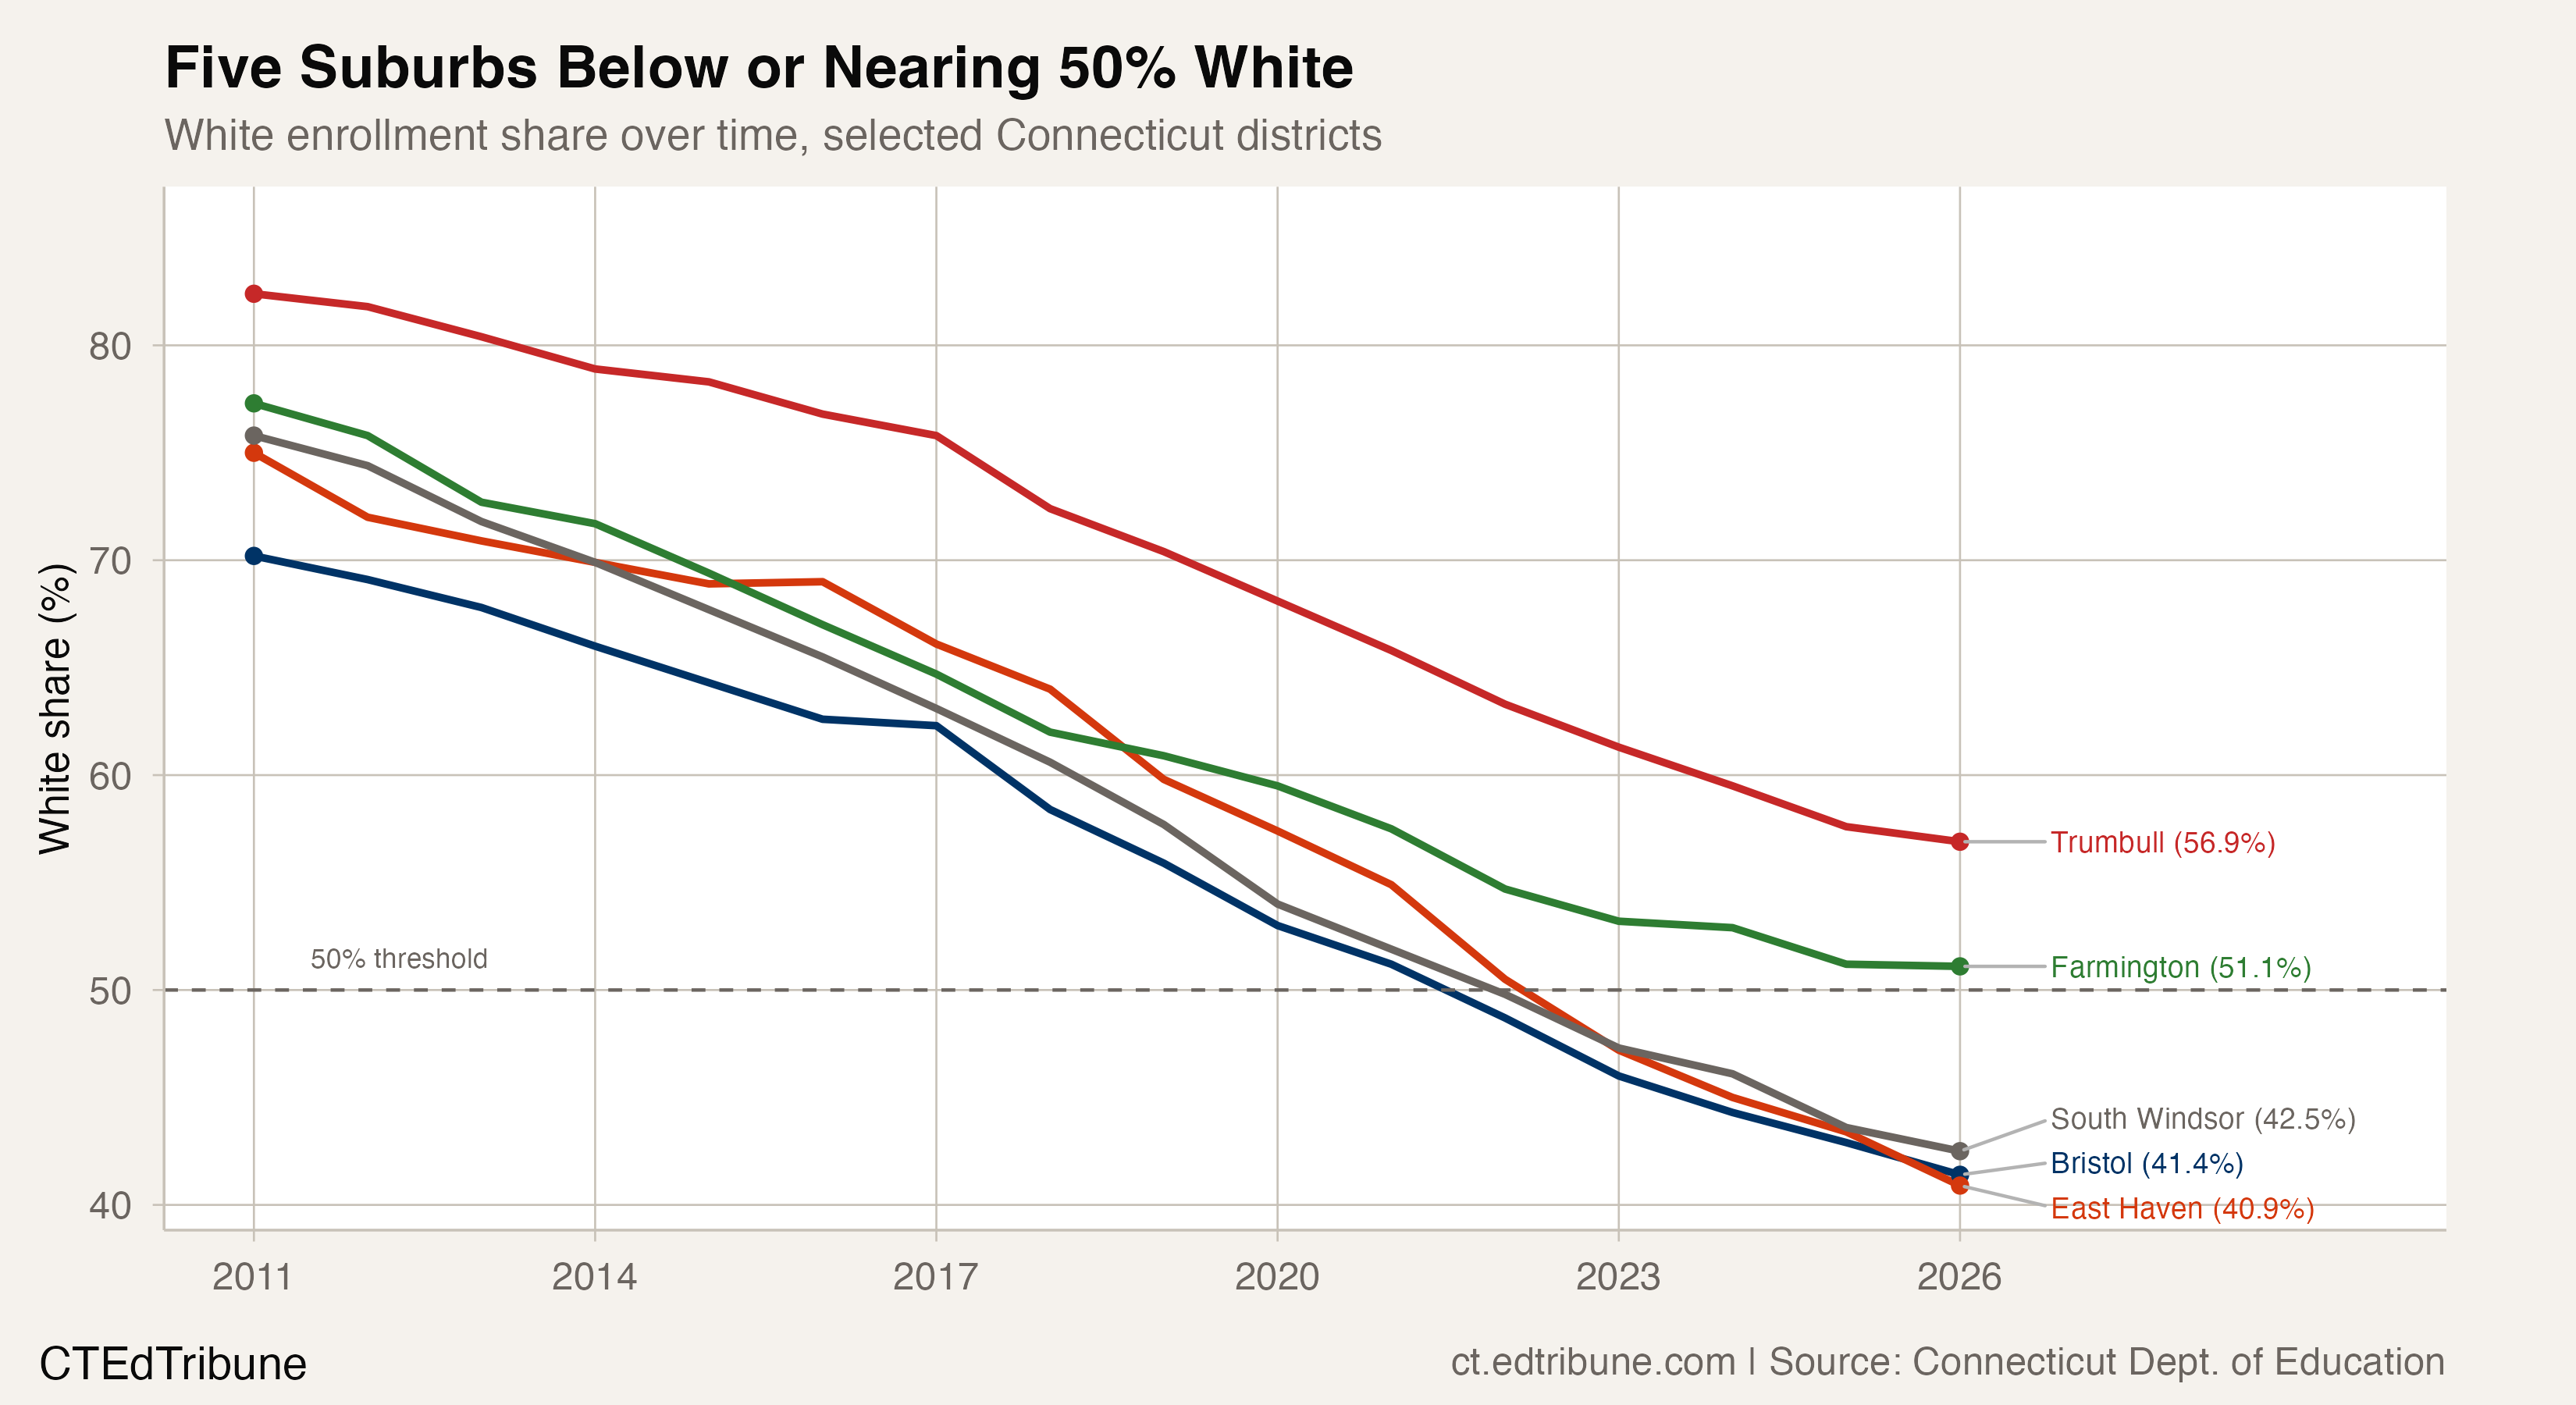
The second pathway is Asian-driven. South Windsor↗ET, a Hartford suburb along the I-91 corridor, went from 75.8% white to 42.5% white. The replacement population is not Hispanic but Asian: South Windsor's Asian enrollment surged from 9.5% to 35.6%, a 26.1 percentage-point increase that has made it one of the most Asian school districts in New England. Farmington↗ET, another affluent Hartford suburb, shows a parallel pattern. White share fell from 77.3% to 51.1%, with Asian enrollment rising from 12.6% to 24.9%. Rocky Hill↗ET followed the same trajectory, its Asian share climbing from 13.5% to 31.0%.
The distinction matters. The Hispanic-driven districts are typically lower-income communities with declining total enrollment, where white families are leaving and being replaced. The Asian-driven districts are affluent suburbs with stable or growing property values, where the change reflects new families moving in rather than old families moving out. Both produce the same statistical outcome, a declining white share, but the community dynamics are fundamentally different.
Fifteen districts crossed the line
Since 2011, 15 Connecticut districts have crossed from majority-white to majority-minority enrollment. Five of them started with white shares above 70%: East Haven (75.0% to 40.9%), South Windsor (75.8% to 42.5%), Torrington (72.3% to 42.7%), Bristol (70.2% to 41.4%), and Rocky Hill (74.9% to 46.3%).
Others were closer to the threshold and crossed earlier. Derby↗ET fell from 56.6% to 24.0% white. Ansonia went from 51.9% to 21.5%. Newington↗ET is the most recent to cross, sitting at exactly 49.5% white, down from 68.9%.
Statewide, the number of majority-white districts fell from 154 out of 186 in 2011 (82.8%) to 135 out of 193 in 2026 (69.9%). At the other extreme, only three districts in the state remain above 90% white: Colebrook (93.2%), Canaan (91.5%), and Barkhamsted (90.9%). All three enroll fewer than 250 students.
The demographic engine behind the numbers
The most likely driver is differential birth rates. According to March of Dimes data, the fertility rate among Hispanic women in Connecticut averaged 62.1 per 1,000 women ages 15-44 during 2020-2022, compared to 47.4 for white women. White births account for 52.8% of Connecticut births, according to the 2021-2023 state average, while white students now represent 44.7% of enrollment. That 8-point gap between birth share and enrollment share suggests the pipeline has been shifting for years before it shows up in school-age data.
Immigration is a second factor. DataHaven reports that roughly 20% of Connecticut's population was born abroad, up from 17% in 2010. Immigrants comprise approximately 15% of the state's total population and 30% of children live in immigrant families. Much of this immigration has been Hispanic, and increasingly it has settled directly in suburban towns rather than concentrating in cities first.
A competing explanation is white flight to private schools or out-of-state. Connecticut's Catholic school system has lost 23% of its enrollment over the past decade, suggesting private schools are not absorbing the white students leaving public systems. Out-migration is harder to measure, but Connecticut's overall population has been roughly flat, losing domestic residents while gaining international immigrants. The data cannot distinguish how much of the white enrollment decline reflects families leaving the state versus simply having fewer children.
What the funding formula sees
The demographic shift carries fiscal weight. A CT Examiner analysis found that Connecticut districts with 60% or more white students typically spend $24,000 to $30,000 per pupil, while majority-minority districts rarely exceed $22,000. Greenwich spends $27,093 per student; Waterbury spends $18,405. The gap reflects property wealth: Greenwich's grand list is $34.8 billion; Waterbury's is $6.6 billion.
"An institutionally racist system, a system that ties educational opportunity to property wealth." — CT Examiner, November 2025
As districts like Bristol and East Haven shift from majority-white to majority-minority, they face a structural mismatch: their property tax bases were built for a different enrollment profile, and their per-pupil spending was already closer to the urban end of the spectrum. The demographic transition outpaces the funding formula's ability to adjust.
A case study in two towns
Danbury↗ET illustrates the endpoint. In 2011, the city's schools were 44.7% white, already a plurality rather than a majority. In 2025-26, Danbury is 19.0% white and 66.7% Hispanic, a degree of transformation that rivals any urban district in the state. Its 25.7 percentage-point white share drop ranks among the largest for districts with more than 1,500 students.
Trumbull↗ET, by contrast, shows where the wealthier suburbs stand on the curve. Still 56.9% white, down from 82.4%, Trumbull has lost 1,847 white students since 2011. At the current rate of decline, roughly 1.5 to 2 percentage points per year, Trumbull would cross below 50% white around 2030. Shelton↗ET (55.2%, down from 82.3%) and Bethel↗ET (52.1%, down from 77.6%) are even closer.
What multiracial growth complicates
One category complicates the binary framing. Multiracial enrollment surged 166% statewide, from 9,225 to 24,533 students, now representing 4.9% of enrollment. The multiracial category grew faster than any other group in Connecticut. Some of the white share decline reflects families identifying children as multiracial rather than white, a classification shift that does not correspond to any change in who is sitting in the classroom. The data cannot distinguish how much of the white decline is reclassification versus actual demographic replacement.
What to watch
The question facing Connecticut's suburban districts is not whether the demographic transition will continue but how fast. The fertility gap between white and Hispanic women, combined with ongoing immigration, suggests the share trajectory is locked in for at least another decade. Birth data predicts kindergarten enrollment five years in advance, and Connecticut's birth share numbers already show white births below 53%.
For districts like Trumbull, Shelton, and Bethel, now hovering in the mid-50s percent white, the question is whether crossing below 50% triggers any measurable change in school choice behavior, housing patterns, or political dynamics around school funding. In East Haven and Bristol, that crossing happened quietly, with no discernible policy response. Whether the same holds true in Connecticut's wealthier suburbs remains to be seen.
Detailed code that reproduces the analysis and figures in this article is available exclusively to EdTribune subscribers.
Discussion
Sign in to join the discussion.
Loading comments...