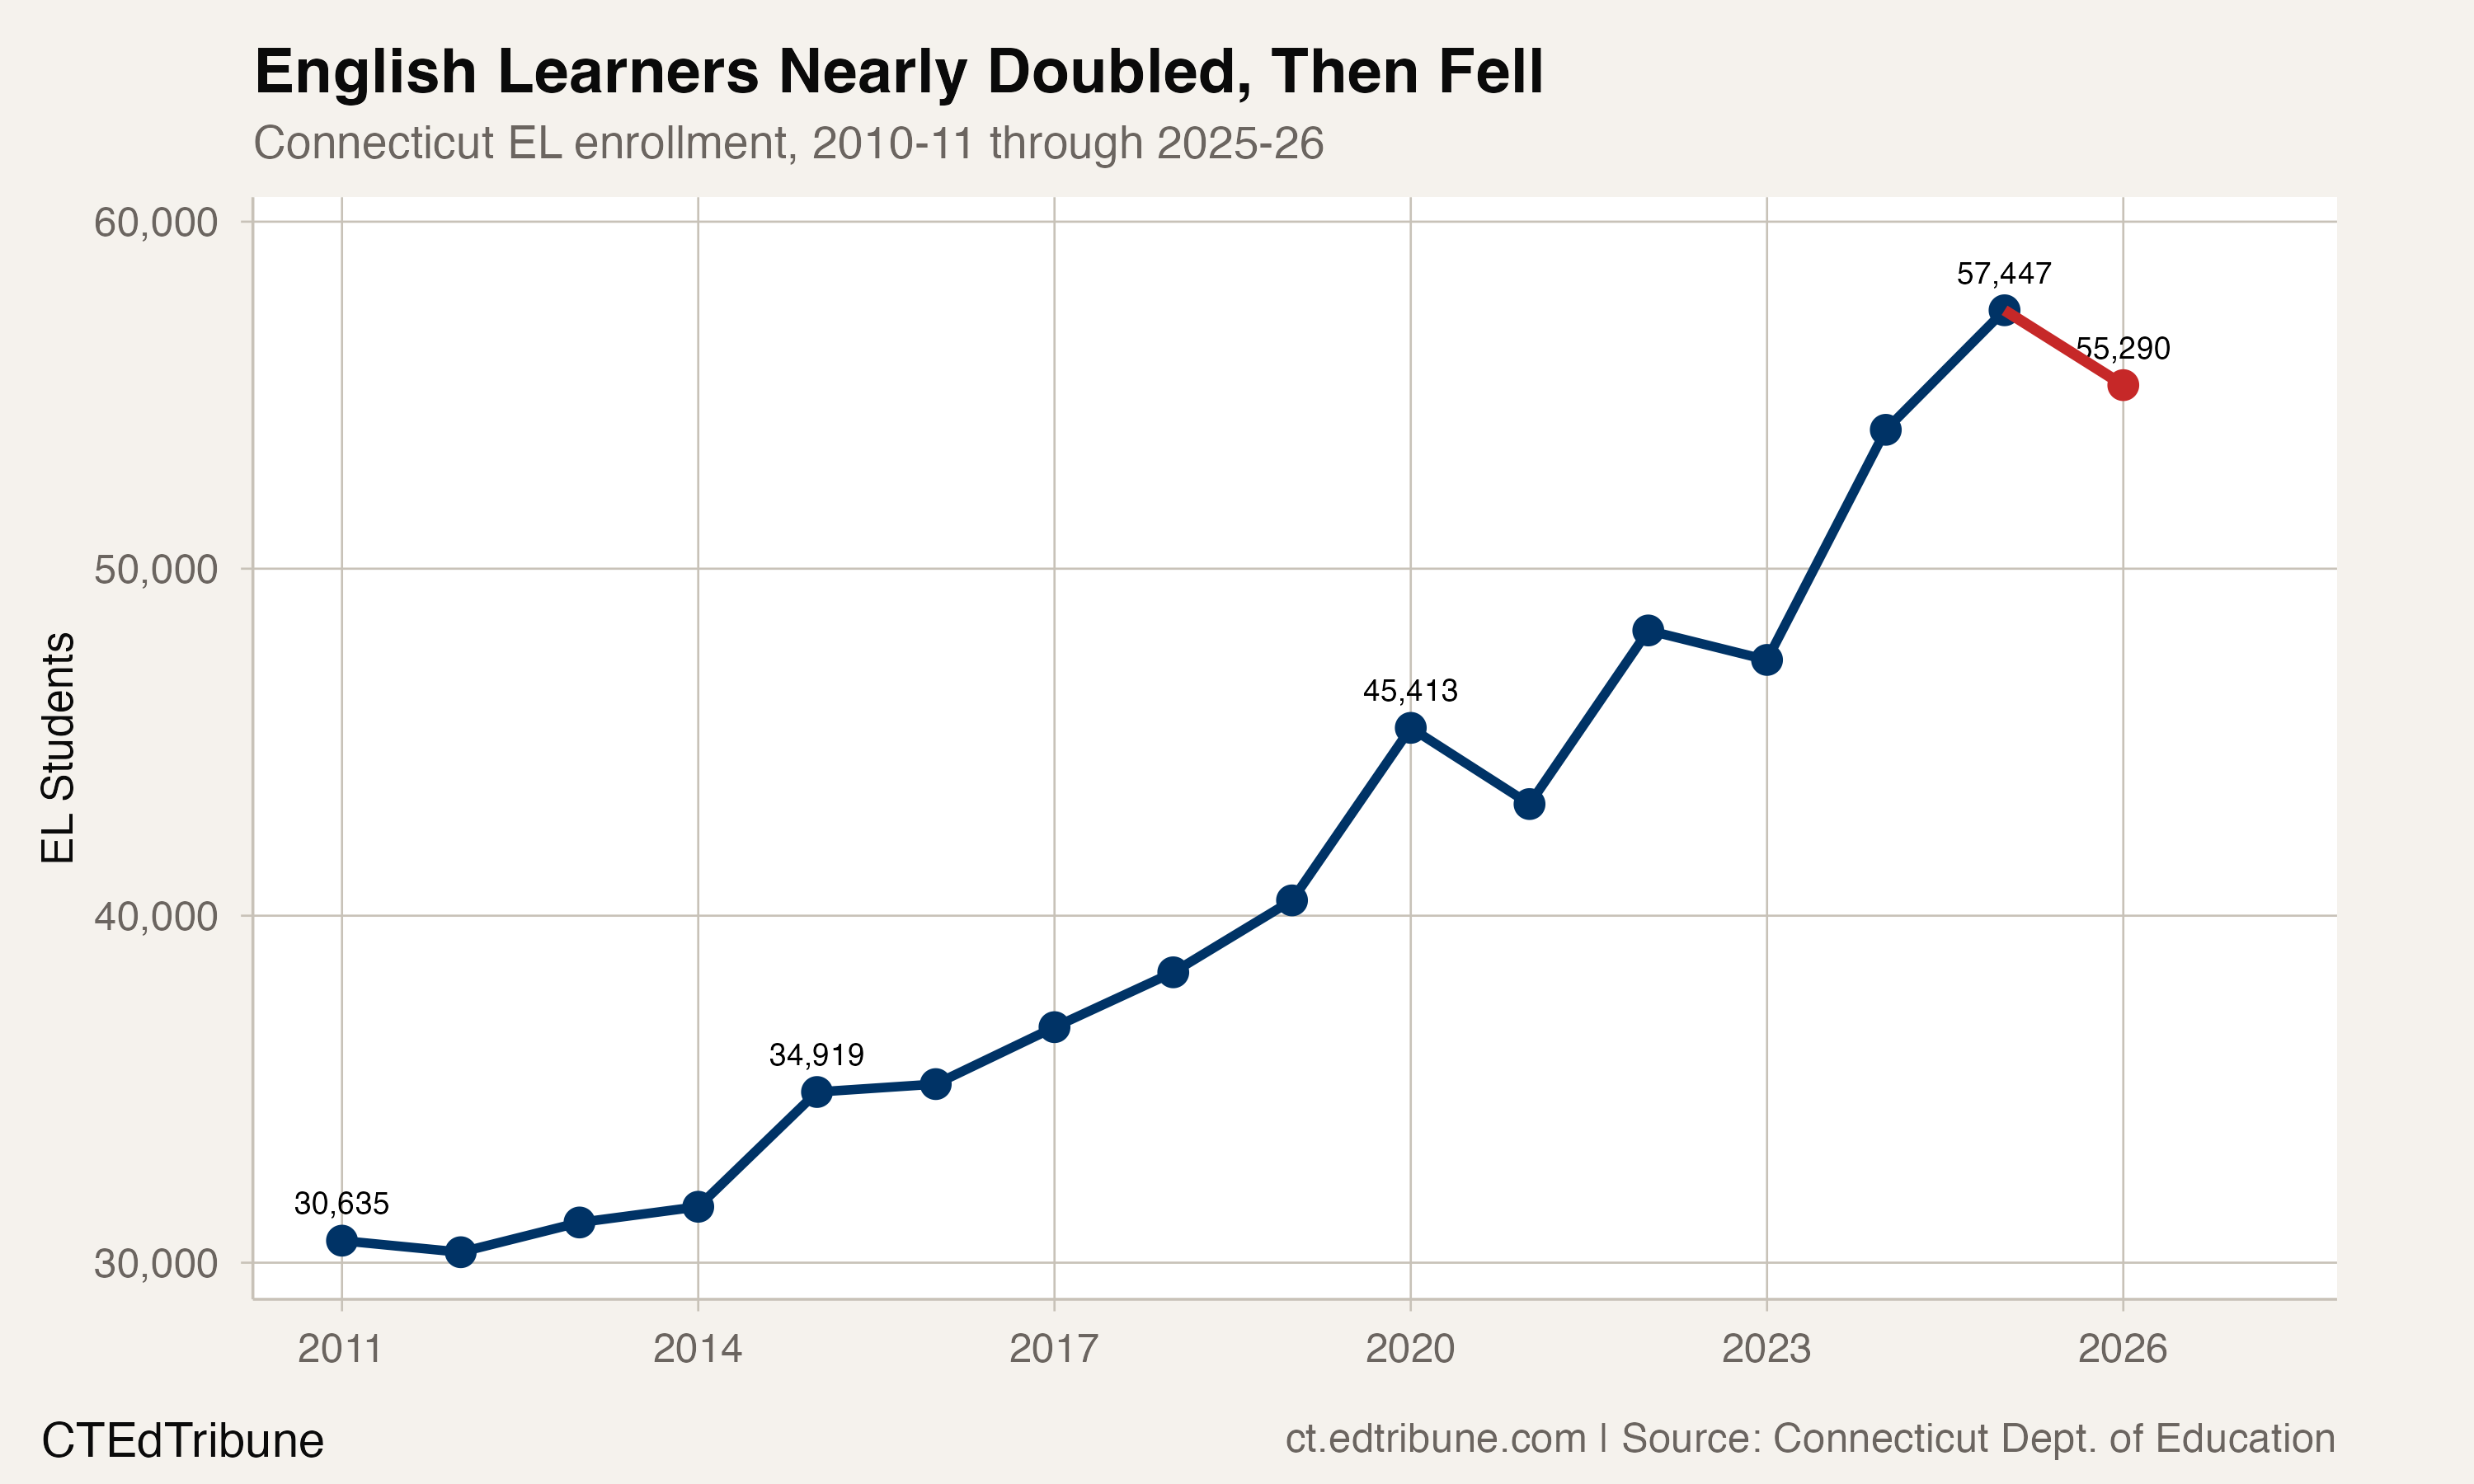
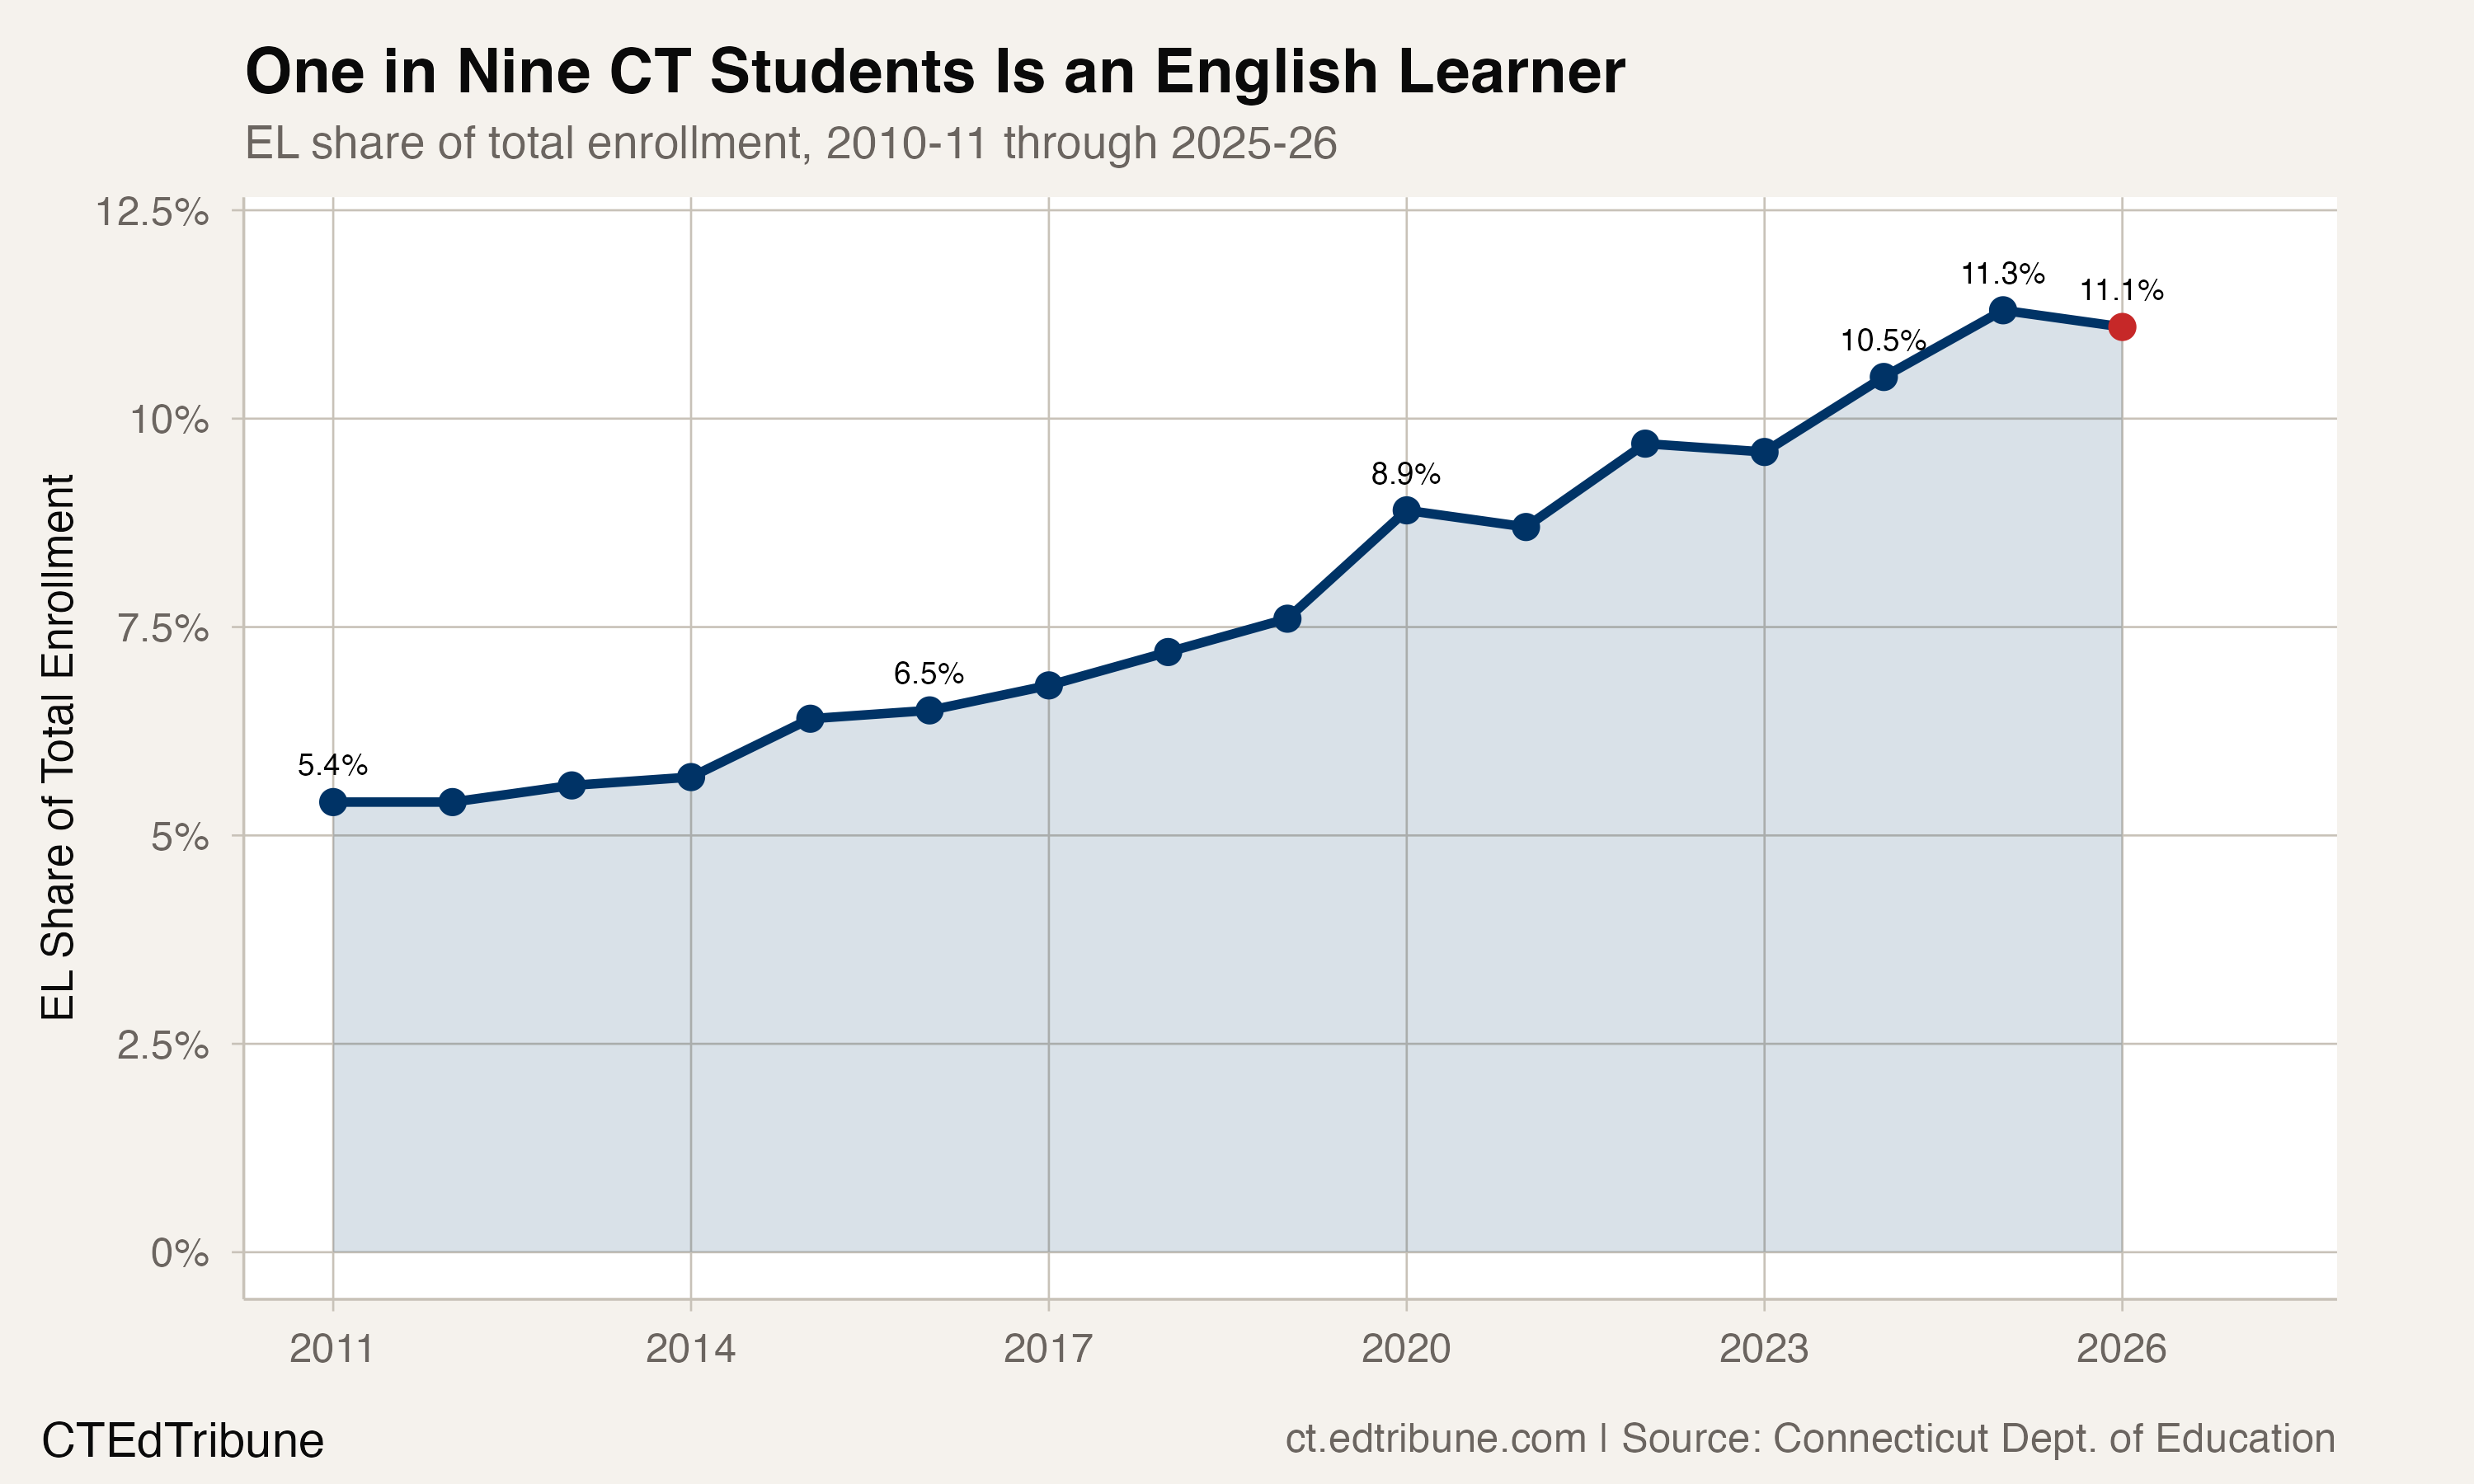
For 15 years, English learner enrollment was the one number in Connecticut that moved in the right direction. While the state shed 66,739 students between 2010-11 and 2025-26, a loss of 11.8%, its English learner population climbed from 30,635 to a peak of 57,447, an 87.5% increase that pushed EL students from 5.4% of total enrollment to 11.3%. One in nine Connecticut public school students was classified as an English learner by 2024-25.
Then the number reversed. In 2025-26, English learner enrollment fell by 2,157 students, a 3.8% decline to 55,290. The drop nearly matches the 2,196 EL students lost during the first year of COVID. Eighty-five districts lost EL students. Only 64 gained them.
The scope of 15 years of growth
The scale of the EL growth is difficult to overstate. Connecticut added 24,655 English learners between 2010-11 and 2025-26 even as total enrollment contracted by nearly 67,000. The EL share of enrollment more than doubled, from 5.4% to 11.1%.
That growth was not smooth. The year-over-year pattern reveals surges and dips: a gain of 4,972 in 2019-20, a COVID-driven loss of 2,196 in 2020-21, a rebound of 5,003 in 2021-22, and then the largest single-year gain on record, 6,631, in 2023-24. The two years before the reversal were the strongest in the dataset.
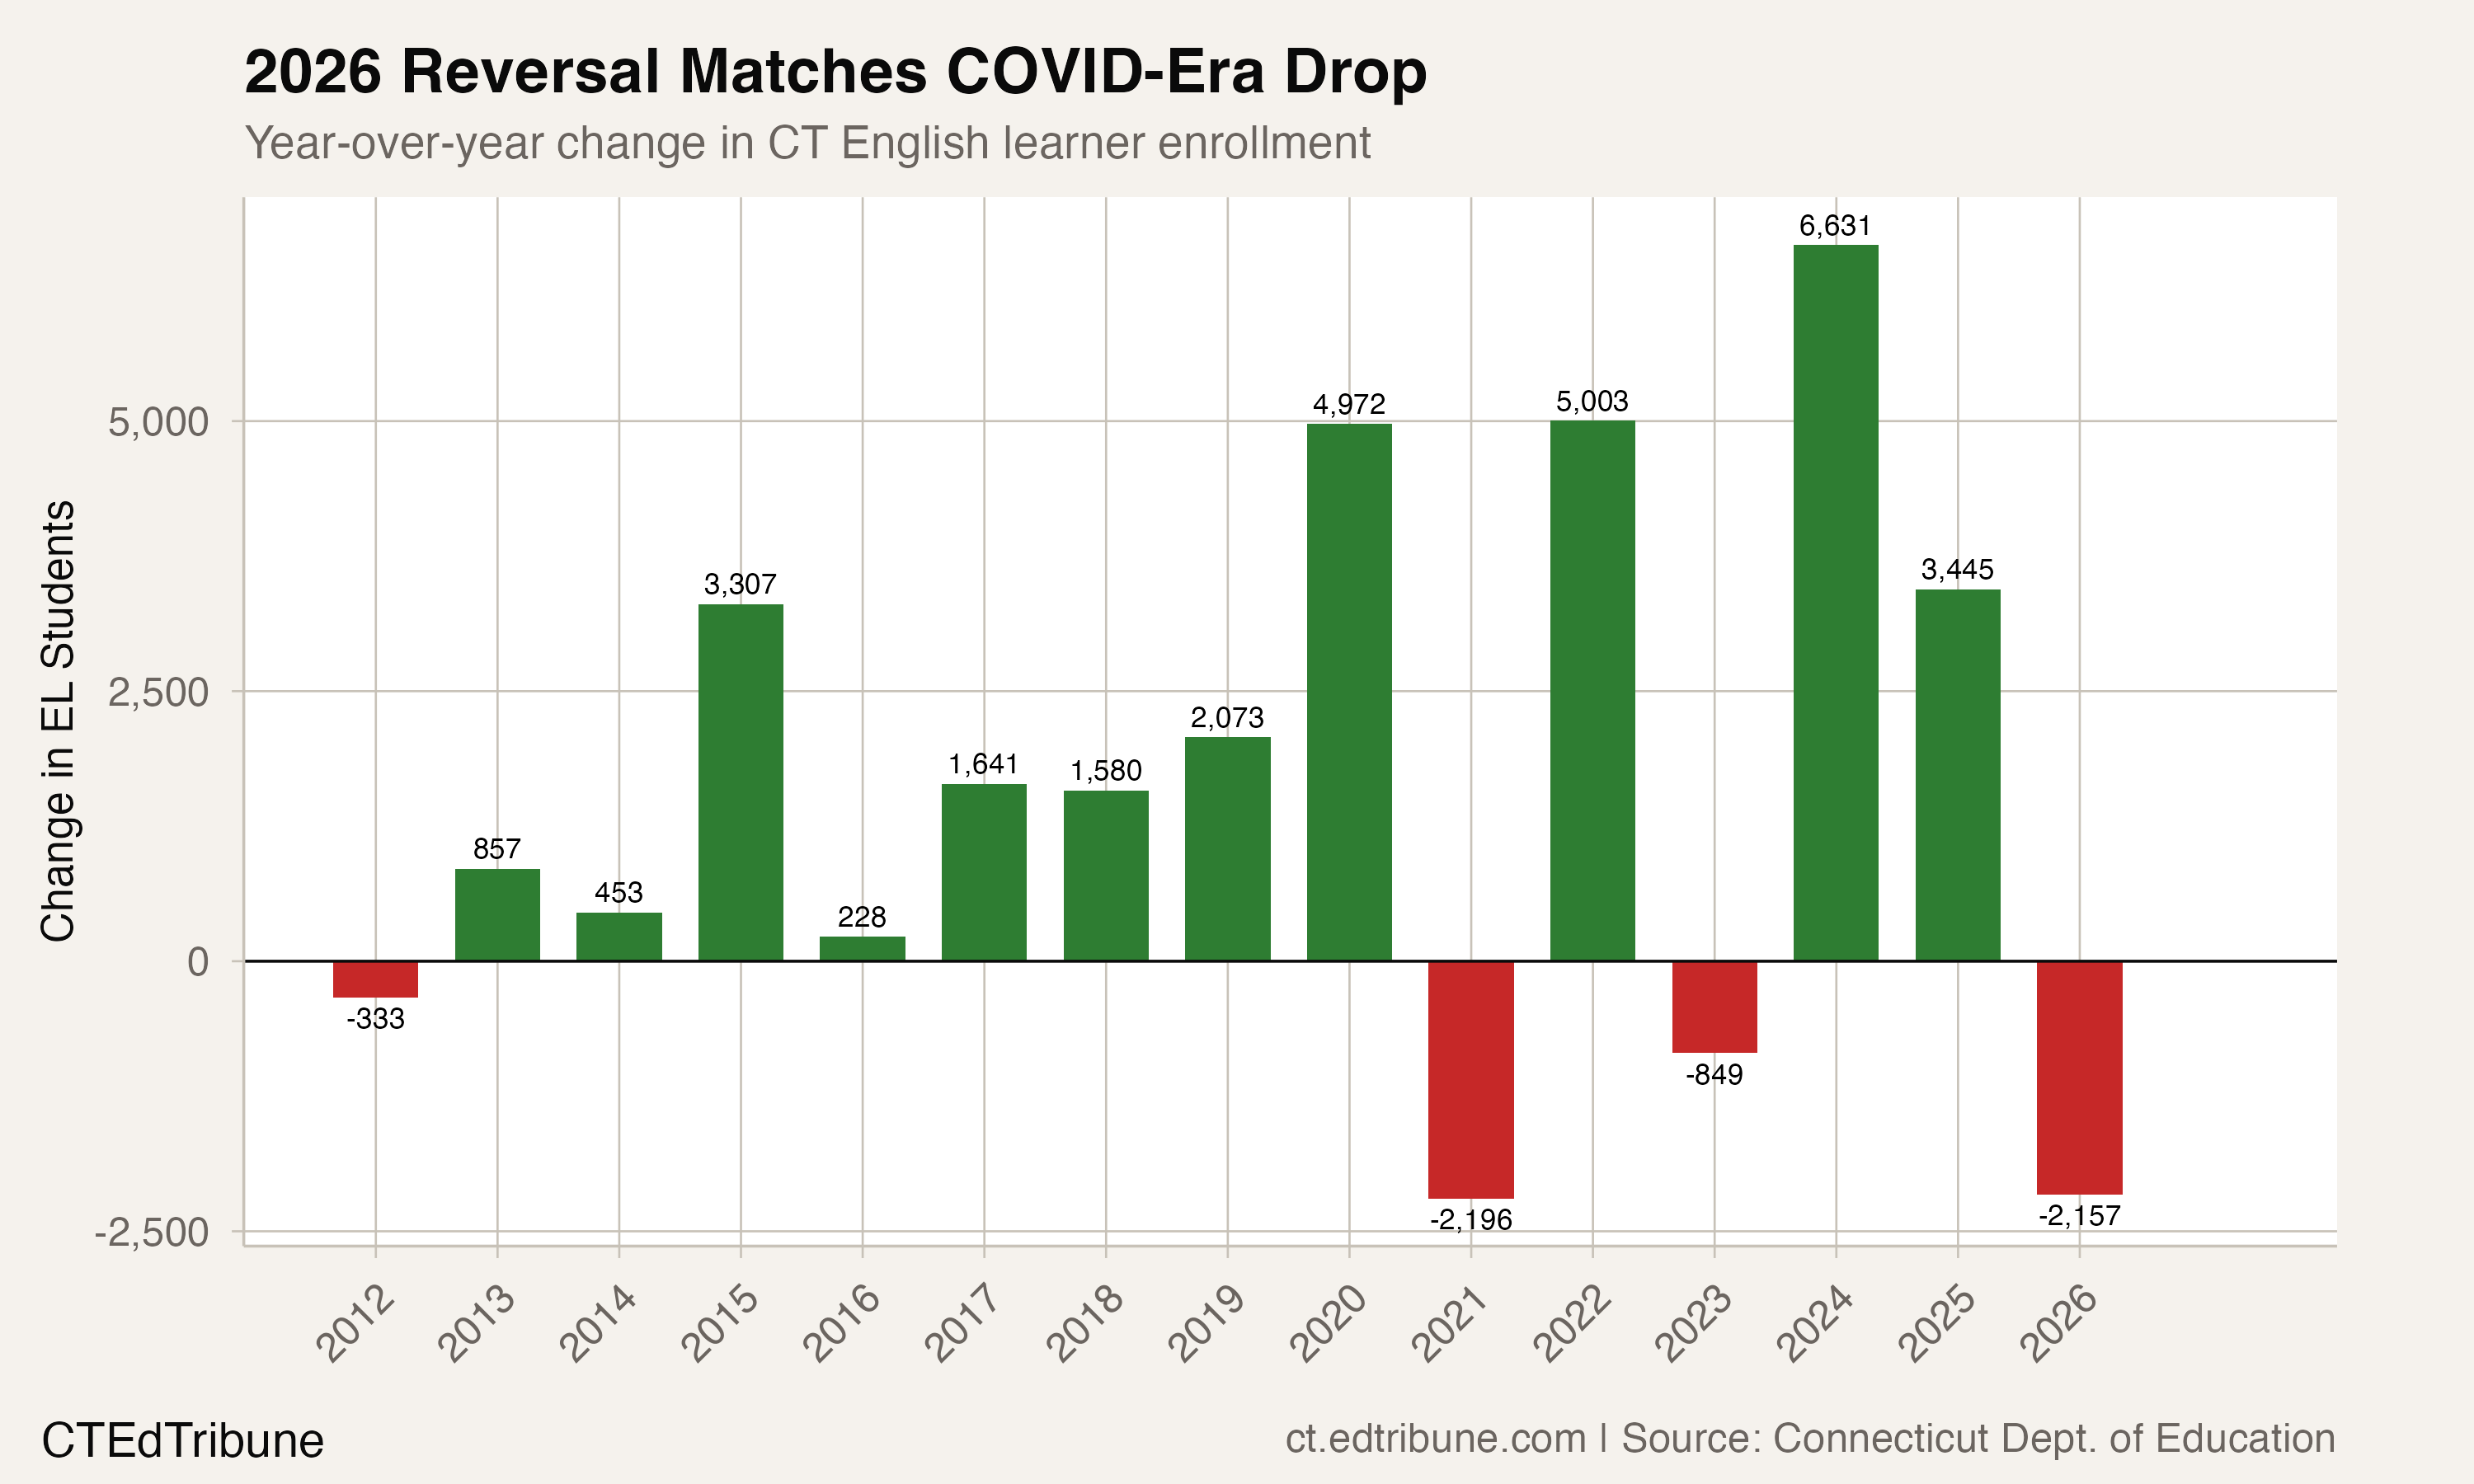
The 2025-26 decline stands out because it breaks the pattern at a moment of acceleration. This is not a gradual tapering. Connecticut went from adding 6,631 EL students in 2023-24 to losing 2,157 two years later, a swing of nearly 8,800 students.
Where the losses are concentrated
Five districts account for 54.9% of all EL enrollment losses statewide: Hartford↗ET (-388), New Haven↗ET (-338), Danbury↗ET (-309), Bridgeport↗ET (-295), and Stamford↗ET (-213). These are the same cities that drove EL growth for the past decade. Bridgeport alone added 3,283 English learners between 2010-11 and 2025-26, a 124.2% increase. Danbury added 2,204, more than doubling its EL population.
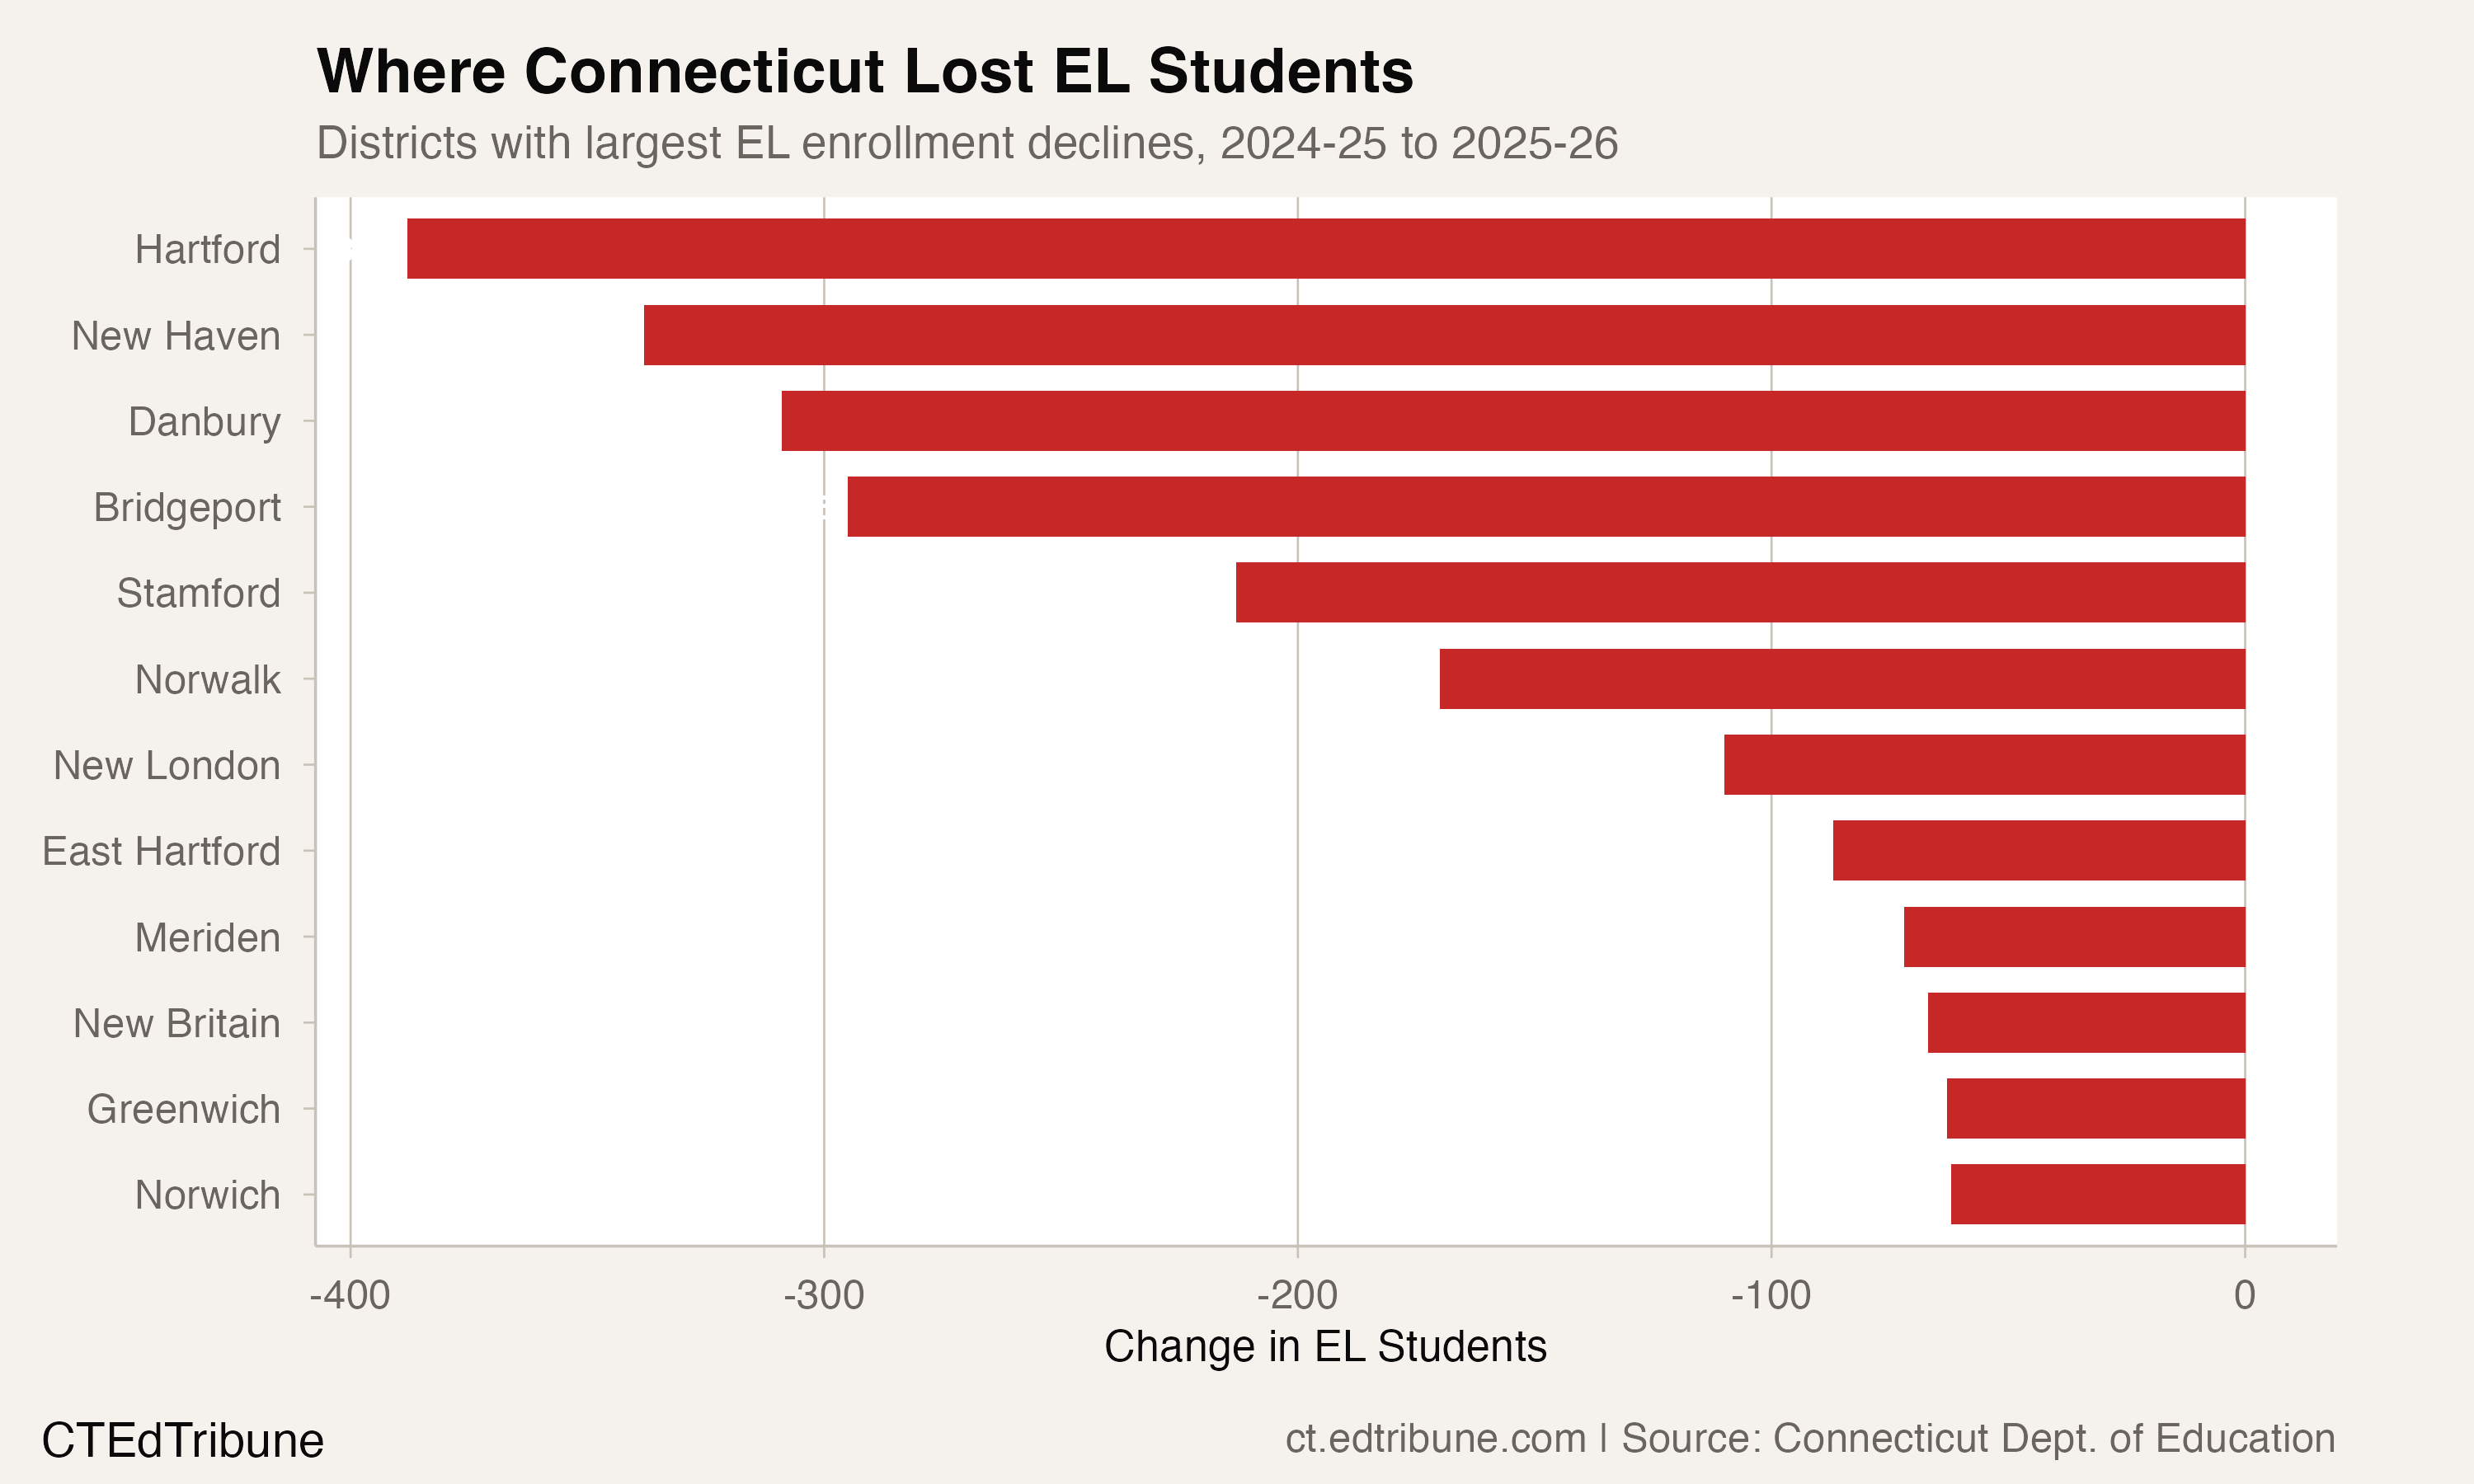
The losses hit hardest, in percentage terms, outside the largest cities. New London↗ET lost 110 EL students, an 11.6% decline. Greenwich lost 63, a 13.7% drop. But the big-city losses are the ones that reshape staffing and budgets. Hartford's loss of 388 EL students is the largest single-district decline in the state. New Haven's 338-student decline, a 7.4% drop, forced the district to close a newcomer classroom for the first time in years.
Immigration enforcement as a plausible driver
The timing of the decline aligns with a specific policy change. On January 20, 2025, the Trump administration rescinded the 13-year-old "sensitive locations" policy that had prohibited Immigration and Customs Enforcement from conducting enforcement operations at schools, hospitals, and places of worship. The reversal meant that for the first time since 2011, ICE agents could legally make arrests on school grounds.
The direct evidence connecting this policy to Connecticut's enrollment decline is limited but suggestive. Hartford Superintendent Andrae Townsel attributed the drop to "fewer newcomer students due to immigration-related concerns with policies at the federal government level and shifting migration patterns," according to CT Mirror reporting.
In New Haven, the shift was visible in the district's newcomer program. Superintendent Negron described the change as atypical, noting that in prior years she had to open additional classrooms each fall:
"This year we did not have to open a seat. I actually had to close down a classroom." -- CT Mirror, Dec. 2025
The mechanism is not straightforward. The enrollment numbers reflect October counts, which capture who registered for the school year. Families who chose not to enroll their children would not appear in these figures at all. The data cannot distinguish between families who left Connecticut, families who kept children home, and families who enrolled children but did not identify them for EL services.
The consequences of the policy change have been concrete in Connecticut. In New Haven, a mother was arrested during a school run in June 2025 while her two U.S. citizen children watched. The district trained all 2,900 employees on ICE entry protocols before the inauguration. Superintendent Negron implemented a policy requiring legal verification of a valid warrant before any immigration agent could enter a school building.
A Brown University working paper examining Connecticut and Rhode Island attendance data found that EL students experienced measurable increases in chronic absenteeism during the 2024-25 school year compared to non-EL peers. The enrollment decline in 2025-26 may compound an attendance problem that was already building.
An alternative explanation: the arrival pipeline
Immigration enforcement is not the only plausible mechanism. Federal border policy changes in 2024 and 2025 reduced new arrivals nationally. If fewer immigrant families are reaching Connecticut, EL enrollment would fall even without any fear-driven withdrawal from schools.
Hartford's superintendent made this distinction explicitly, pointing to "shifting migration patterns" alongside enforcement concerns. Connecticut's EL enrollment surged by 6,631 in 2023-24, a year when border crossings were at historically high levels. The 2025-26 decline may partly reflect a return to a lower baseline of new arrivals rather than a departure of families already enrolled.
The enrollment data cannot resolve this question. A drop in EL enrollment could mean fewer new arrivals (an inflow problem), families withdrawing enrolled children (an outflow problem), or families declining to identify their children for language services even when enrolled (a classification problem). The observed pattern, where 85 districts lost EL students simultaneously, is consistent with all three explanations, and likely reflects some combination.
How the EL share reshaped Connecticut's schools
Even after the 2025-26 decline, English learners account for a larger share of Connecticut's student body than at any point before 2024-25. The share dipped from 11.3% to 11.1%, still double the 5.4% share from 2010-11.
That share is not evenly distributed. Three districts now have EL populations exceeding 30% of total enrollment: Danbury at 36.5%, Windham at 32.4%, and Bridgeport at 30.6%. Thirteen districts have EL shares above 20%. In Norwalk, where 22.2% of students are English learners, the district lost 170 EL students in a single year.

Danbury's concentration is particularly striking. The city's EL population grew 111.3% over 15 years, from 1,980 to 4,184 students. More than one in three Danbury students receives English language services. Yet even Danbury lost 309 EL students in 2025-26, a 6.9% decline.
A parallel decline in Hispanic enrollment
The EL reversal does not exist in isolation. Hispanic enrollment, which overlaps substantially with the EL population, also fell in 2025-26 for the first time in the dataset, dropping by 1,592 students from 163,210 to 161,618. Hispanic enrollment had grown every year for at least 15 consecutive years before this reversal.
The simultaneous decline in both populations is consistent with the immigration enforcement hypothesis, since Hispanic students represent the largest share of Connecticut's English learner population. It is also consistent with reduced new arrivals from Latin America. The data cannot distinguish between these explanations.
What to watch
The 2025-26 decline was measured from October enrollment counts, eight months after the sensitive-locations policy was rescinded. The full impact, if it is primarily fear-driven, may not have materialized yet. The Annenberg working paper found that attendance gaps between EL and non-EL students were still widening as of spring 2025.
For districts like Danbury and Bridgeport, where more than 30% of students are English learners, the staffing implications are immediate. Bilingual education programs are funded based on EL headcounts. A sustained decline would reduce the Title III funding that supports English language instruction, even as the students who remain continue to need those services.
The question is whether 2025-26 marks a temporary pause in a 15-year trend or the beginning of a structural reversal. The answer depends on whether the drop reflects families who left, families who are still here but afraid, or families who simply stopped arriving. Each scenario produces a different budget, a different classroom, and a different set of obligations for a state where one in nine students is still learning English.
Detailed code that reproduces the analysis and figures in this article is available exclusively to EdTribune subscribers.
Discussion
Sign in to join the discussion.
Loading comments...